I am trying to use DDP for a training code that I use MLOps Pipeline Templates to run the job. Backend is NCCL
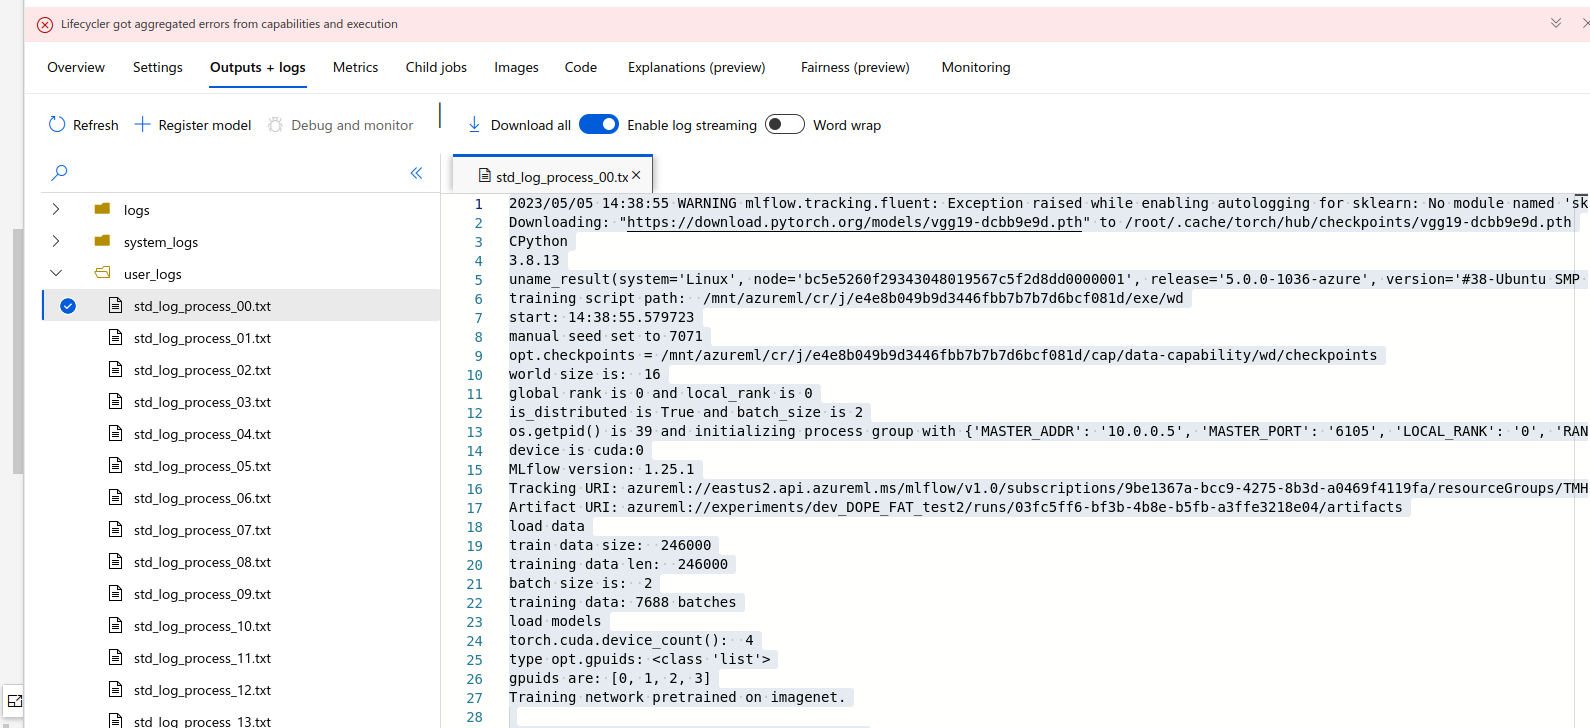
2023/05/04 19:35:32 WARNING mlflow.tracking.fluent: Exception raised while enabling autologging for sklearn: No module named 'sklearn.utils.testing'
Downloading: "https://download.pytorch.org/models/vgg19-dcbb9e9d.pth" to /root/.cache/torch/hub/checkpoints/vgg19-dcbb9e9d.pth
CPython
3.8.13
uname_result(system='Linux', node='e6bf0f05f6f44321b97ab2dff8cda44c000000', release='5.0.0-1036-azure', version='#38-Ubuntu SMP Sun Mar 22 21:27:21 UTC 2020', machine='x86_64', processor='x86_64')
training script path: /mnt/azureml/cr/j/05ab7c96066d41ea841fe18077f16b59/exe/wd
start: 19:35:32.127799
manual seed set to 4395
opt.checkpoints = /mnt/azureml/cr/j/05ab7c96066d41ea841fe18077f16b59/cap/data-capability/wd/checkpoints
world size is: 16
global rank is 0 and local_rank is 0
is_distributed is True and batch_size is 2
os.getpid() is 39 and initializing process group with {'MASTER_ADDR': '10.0.0.4', 'MASTER_PORT': '6105', 'LOCAL_RANK': '0', 'RANK': '0', 'WORLD_SIZE': '16'}
device is cuda:0
MLflow version: 1.25.1
Tracking URI: my_URI
Artifact URI: my_URI
load data
train data size: 246000
training data len: 246000
batch size is: 2
training data: 7688 batches
load models
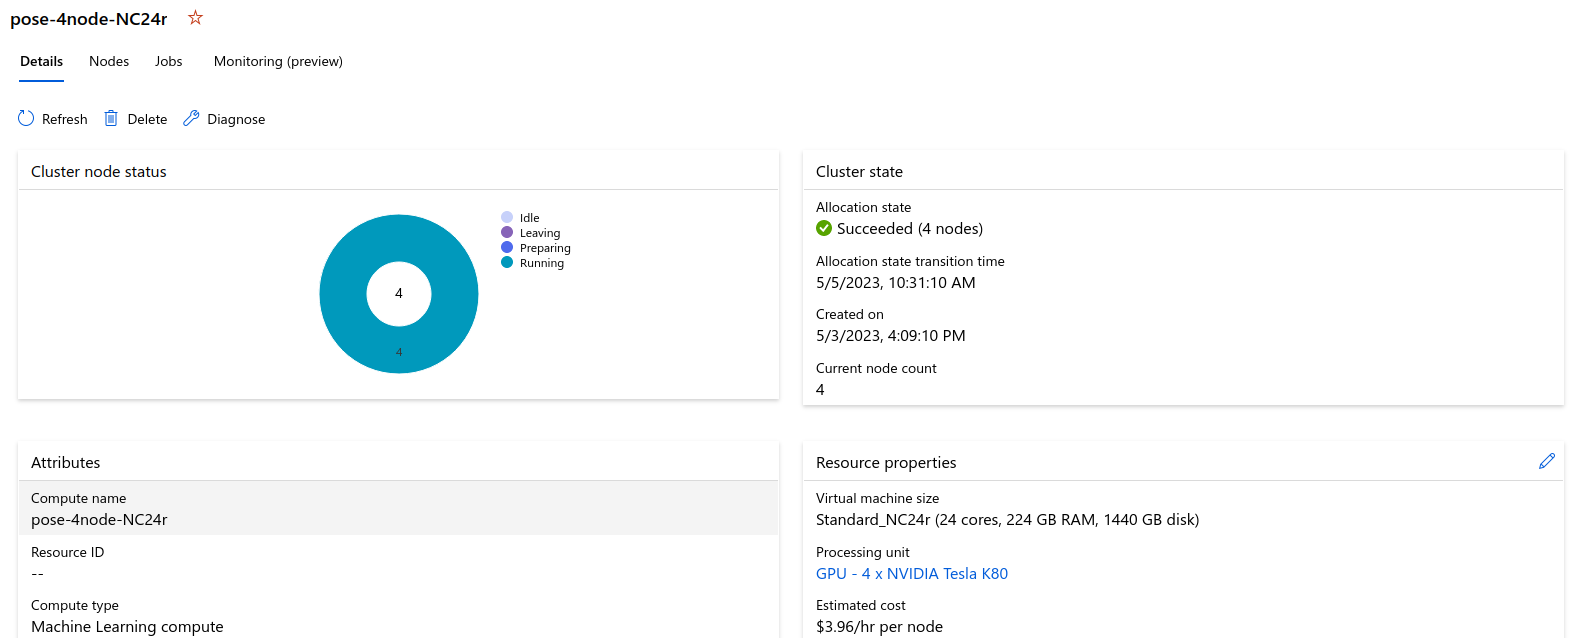
torch.cuda.device_count(): 4
type opt.gpuids: <class 'list'>
gpuids are: [0, 1, 2, 3]
Training network pretrained on imagenet.
0%| | 0.00/548M [00:00<?, ?B/s]
0%| | 1.54M/548M [00:00<00:35, 16.1MB/s]
1%| | 5.98M/548M [00:00<00:17, 31.8MB/s]
3%|▎ | 17.3M/548M [00:00<00:07, 70.1MB/s]
4%|▍ | 24.1M/548M [00:00<00:08, 65.9MB/s]
7%|▋ | 37.0M/548M [00:00<00:06, 89.2MB/s]
9%|▉ | 48.4M/548M [00:00<00:05, 99.3MB/s]
11%|█ | 61.1M/548M [00:00<00:04, 108MB/s]
13%|█▎ | 72.5M/548M [00:00<00:04, 112MB/s]
15%|█▌ | 83.3M/548M [00:00<00:04, 99.1MB/s]
17%|█▋ | 93.3M/548M [00:01<00:04, 101MB/s]
19%|█▉ | 106M/548M [00:01<00:04, 111MB/s]
22%|██▏ | 119M/548M [00:01<00:03, 113MB/s]
24%|██▍ | 131M/548M [00:01<00:03, 115MB/s]
26%|██▌ | 142M/548M [00:01<00:04, 97.3MB/s]
28%|██▊ | 152M/548M [00:01<00:04, 92.7MB/s]
29%|██▉ | 161M/548M [00:01<00:04, 91.4MB/s]
31%|███ | 171M/548M [00:01<00:04, 93.8MB/s]
33%|███▎ | 180M/548M [00:02<00:04, 92.1MB/s]
34%|███▍ | 189M/548M [00:02<00:04, 86.2MB/s]
36%|███▋ | 199M/548M [00:02<00:04, 89.7MB/s]
38%|███▊ | 209M/548M [00:02<00:03, 93.3MB/s]
40%|████ | 222M/548M [00:02<00:03, 105MB/s]
42%|████▏ | 232M/548M [00:02<00:03, 103MB/s]
44%|████▍ | 242M/548M [00:02<00:03, 95.5MB/s]
46%|████▋ | 254M/548M [00:02<00:03, 103MB/s]
48%|████▊ | 264M/548M [00:02<00:03, 96.8MB/s]
50%|█████ | 274M/548M [00:03<00:02, 100MB/s]
52%|█████▏ | 284M/548M [00:03<00:02, 97.3MB/s]
54%|█████▎ | 294M/548M [00:03<00:02, 101MB/s]
55%|█████▌ | 304M/548M [00:03<00:02, 98.2MB/s]
58%|█████▊ | 318M/548M [00:03<00:02, 111MB/s]
60%|█████▉ | 329M/548M [00:03<00:02, 104MB/s]
62%|██████▏ | 339M/548M [00:03<00:02, 93.6MB/s]
63%|██████▎ | 348M/548M [00:04<00:03, 57.2MB/s]
65%|██████▍ | 355M/548M [00:04<00:03, 55.3MB/s]
66%|██████▌ | 361M/548M [00:04<00:03, 57.2MB/s]
68%|██████▊ | 371M/548M [00:04<00:02, 66.9MB/s]
70%|██████▉ | 382M/548M [00:04<00:02, 79.0MB/s]
71%|███████▏ | 392M/548M [00:04<00:01, 83.1MB/s]
73%|███████▎ | 401M/548M [00:04<00:01, 87.3MB/s]
75%|███████▍ | 410M/548M [00:04<00:01, 89.8MB/s]
77%|███████▋ | 422M/548M [00:04<00:01, 98.6MB/s]
79%|███████▉ | 433M/548M [00:05<00:01, 103MB/s]
81%|████████ | 444M/548M [00:05<00:01, 102MB/s]
83%|████████▎ | 456M/548M [00:05<00:00, 108MB/s]
86%|████████▌ | 472M/548M [00:05<00:00, 123MB/s]
89%|████████▉ | 490M/548M [00:05<00:00, 141MB/s]
92%|█████████▏| 506M/548M [00:05<00:00, 149MB/s]
95%|█████████▌| 521M/548M [00:05<00:00, 150MB/s]
98%|█████████▊| 537M/548M [00:05<00:00, 156MB/s]
100%|██████████| 548M/548M [00:05<00:00, 99.0MB/s]e6bf0f05f6f44321b97ab2dff8cda44c000000:39:39 [0] NCCL INFO NCCL_SOCKET_IFNAME set by environment to eth0
e6bf0f05f6f44321b97ab2dff8cda44c000000:39:39 [0] NCCL INFO Bootstrap : Using eth0:10.0.0.4<0>
e6bf0f05f6f44321b97ab2dff8cda44c000000:39:39 [0] NCCL INFO Plugin Path : /opt/hpcx/nccl_rdma_sharp_plugin/lib/libnccl-net.so
e6bf0f05f6f44321b97ab2dff8cda44c000000:39:39 [0] NCCL INFO P2P plugin IBext
e6bf0f05f6f44321b97ab2dff8cda44c000000:39:39 [0] NCCL INFO NCCL_IB_PCI_RELAXED_ORDERING set by environment to 1.
e6bf0f05f6f44321b97ab2dff8cda44c000000:39:39 [0] NCCL INFO NCCL_SOCKET_IFNAME set by environment to eth0
e6bf0f05f6f44321b97ab2dff8cda44c000000:39:39 [0] ibvwrap.c:66 NCCL WARN Call to ibv_open_device failed
e6bf0f05f6f44321b97ab2dff8cda44c000000:39:39 [0] p2p_plugin.c:190 NCCL WARN NET/IB : Unable to open device mlx4_0
e6bf0f05f6f44321b97ab2dff8cda44c000000:39:39 [0] NCCL INFO NET/IB : No device found.
e6bf0f05f6f44321b97ab2dff8cda44c000000:39:39 [0] NCCL INFO NCCL_IB_DISABLE set by environment to 1.
e6bf0f05f6f44321b97ab2dff8cda44c000000:39:39 [0] NCCL INFO NCCL_SOCKET_IFNAME set by environment to eth0
e6bf0f05f6f44321b97ab2dff8cda44c000000:39:39 [0] NCCL INFO NET/Socket : Using [0]eth0:10.0.0.4<0>
e6bf0f05f6f44321b97ab2dff8cda44c000000:39:39 [0] NCCL INFO Using network Socket
NCCL version 2.10.3+cuda10.2
e6bf0f05f6f44321b97ab2dff8cda44c000000:39:396 [0] NCCL INFO Topology detection : could not read /sys/devices/LNXSYSTM:00/LNXSYBUS:00/PNP0A03:00/device:07/VMBUS:01/47505500-0001-0000-3130-444531303244/pci13ff:00/13ff:00:00.0/../max_link_speed, ignoring
e6bf0f05f6f44321b97ab2dff8cda44c000000:39:396 [0] NCCL INFO Topology detection : could not read /sys/devices/LNXSYSTM:00/LNXSYBUS:00/PNP0A03:00/device:07/VMBUS:01/47505500-0001-0000-3130-444531303244/pci13ff:00/13ff:00:00.0/../max_link_width, ignoring
e6bf0f05f6f44321b97ab2dff8cda44c000000:39:396 [0] NCCL INFO Topology detection : could not read /sys/devices/LNXSYSTM:00/LNXSYBUS:00/PNP0A03:00/device:07/VMBUS:01/47505500-0002-0000-3130-444531303244/pci2ad7:00/2ad7:00:00.0/../max_link_speed, ignoring
e6bf0f05f6f44321b97ab2dff8cda44c000000:39:396 [0] NCCL INFO Topology detection : could not read /sys/devices/LNXSYSTM:00/LNXSYBUS:00/PNP0A03:00/device:07/VMBUS:01/47505500-0002-0000-3130-444531303244/pci2ad7:00/2ad7:00:00.0/../max_link_width, ignoring
e6bf0f05f6f44321b97ab2dff8cda44c000000:39:396 [0] NCCL INFO Topology detection : could not read /sys/devices/LNXSYSTM:00/LNXSYBUS:00/PNP0A03:00/device:07/VMBUS:01/47505500-0003-0000-3130-444531303244/pci373d:00/373d:00:00.0/../max_link_speed, ignoring
e6bf0f05f6f44321b97ab2dff8cda44c000000:39:396 [0] NCCL INFO Topology detection : could not read /sys/devices/LNXSYSTM:00/LNXSYBUS:00/PNP0A03:00/device:07/VMBUS:01/47505500-0003-0000-3130-444531303244/pci373d:00/373d:00:00.0/../max_link_width, ignoring
e6bf0f05f6f44321b97ab2dff8cda44c000000:39:396 [0] NCCL INFO Topology detection : could not read /sys/devices/LNXSYSTM:00/LNXSYBUS:00/PNP0A03:00/device:07/VMBUS:01/47505500-0004-0000-3130-444531303244/pci529e:00/529e:00:00.0/../max_link_speed, ignoring
e6bf0f05f6f44321b97ab2dff8cda44c000000:39:396 [0] NCCL INFO Topology detection : could not read /sys/devices/LNXSYSTM:00/LNXSYBUS:00/PNP0A03:00/device:07/VMBUS:01/47505500-0004-0000-3130-444531303244/pci529e:00/529e:00:00.0/../max_link_width, ignoring
e6bf0f05f6f44321b97ab2dff8cda44c000000:39:396 [0] NCCL INFO Topology detection: network path /sys/devices/LNXSYSTM:00/LNXSYBUS:00/PNP0A03:00/device:07/VMBUS:01/000d3adc-6e3b-000d-3adc-6e3b000d3adc is not a PCI device (vmbus). Attaching to first CPU
e6bf0f05f6f44321b97ab2dff8cda44c000000:39:396 [0] NCCL INFO KV Convert to int : could not find value of '' in dictionary, falling back to 60
e6bf0f05f6f44321b97ab2dff8cda44c000000:39:396 [0] NCCL INFO KV Convert to int : could not find value of '' in dictionary, falling back to 60
e6bf0f05f6f44321b97ab2dff8cda44c000000:39:396 [0] NCCL INFO KV Convert to int : could not find value of '' in dictionary, falling back to 60
e6bf0f05f6f44321b97ab2dff8cda44c000000:39:396 [0] NCCL INFO KV Convert to int : could not find value of '' in dictionary, falling back to 60
e6bf0f05f6f44321b97ab2dff8cda44c000000:39:396 [0] NCCL INFO Attribute coll of node net not found
e6bf0f05f6f44321b97ab2dff8cda44c000000:39:396 [0] NCCL INFO === System : maxWidth 5.0 totalWidth 12.0 ===
e6bf0f05f6f44321b97ab2dff8cda44c000000:39:396 [0] NCCL INFO CPU/0 (1/1/1)
e6bf0f05f6f44321b97ab2dff8cda44c000000:39:396 [0] NCCL INFO + PCI[5000.0] - NIC/0
e6bf0f05f6f44321b97ab2dff8cda44c000000:39:396 [0] NCCL INFO + NET[5.0] - NET/0 (0/0/5.000000)
e6bf0f05f6f44321b97ab2dff8cda44c000000:39:396 [0] NCCL INFO + PCI[12.0] - GPU/13FF00000 (0)
e6bf0f05f6f44321b97ab2dff8cda44c000000:39:396 [0] NCCL INFO + PCI[12.0] - GPU/2AD700000 (1)
e6bf0f05f6f44321b97ab2dff8cda44c000000:39:396 [0] NCCL INFO + PCI[12.0] - GPU/373D00000 (2)
e6bf0f05f6f44321b97ab2dff8cda44c000000:39:396 [0] NCCL INFO + PCI[12.0] - GPU/529E00000 (3)
e6bf0f05f6f44321b97ab2dff8cda44c000000:39:396 [0] NCCL INFO ==========================================
e6bf0f05f6f44321b97ab2dff8cda44c000000:39:396 [0] NCCL INFO GPU/13FF00000 :GPU/13FF00000 (0/5000.000000/LOC) GPU/2AD700000 (2/12.000000/PHB) GPU/373D00000 (2/12.000000/PHB) GPU/529E00000 (2/12.000000/PHB) CPU/0 (1/12.000000/PHB) NET/0 (3/5.000000/PHB)
e6bf0f05f6f44321b97ab2dff8cda44c000000:39:396 [0] NCCL INFO GPU/2AD700000 :GPU/13FF00000 (2/12.000000/PHB) GPU/2AD700000 (0/5000.000000/LOC) GPU/373D00000 (2/12.000000/PHB) GPU/529E00000 (2/12.000000/PHB) CPU/0 (1/12.000000/PHB) NET/0 (3/5.000000/PHB)
e6bf0f05f6f44321b97ab2dff8cda44c000000:39:396 [0] NCCL INFO GPU/373D00000 :GPU/13FF00000 (2/12.000000/PHB) GPU/2AD700000 (2/12.000000/PHB) GPU/373D00000 (0/5000.000000/LOC) GPU/529E00000 (2/12.000000/PHB) CPU/0 (1/12.000000/PHB) NET/0 (3/5.000000/PHB)
e6bf0f05f6f44321b97ab2dff8cda44c000000:39:396 [0] NCCL INFO GPU/529E00000 :GPU/13FF00000 (2/12.000000/PHB) GPU/2AD700000 (2/12.000000/PHB) GPU/373D00000 (2/12.000000/PHB) GPU/529E00000 (0/5000.000000/LOC) CPU/0 (1/12.000000/PHB) NET/0 (3/5.000000/PHB)
e6bf0f05f6f44321b97ab2dff8cda44c000000:39:396 [0] NCCL INFO NET/0 :GPU/13FF00000 (3/5.000000/PHB) GPU/2AD700000 (3/5.000000/PHB) GPU/373D00000 (3/5.000000/PHB) GPU/529E00000 (3/5.000000/PHB) CPU/0 (2/5.000000/PHB) NET/0 (0/5000.000000/LOC)
e6bf0f05f6f44321b97ab2dff8cda44c000000:39:396 [0] NCCL INFO Pattern 4, crossNic 0, nChannels 1, speed 5.000000/5.000000, type PHB/PHB, sameChannels 1
e6bf0f05f6f44321b97ab2dff8cda44c000000:39:396 [0] NCCL INFO 0 : NET/0 GPU/0 GPU/1 GPU/2 GPU/3 NET/0
e6bf0f05f6f44321b97ab2dff8cda44c000000:39:396 [0] NCCL INFO Pattern 1, crossNic 0, nChannels 1, speed 6.000000/5.000000, type PHB/PHB, sameChannels 1
e6bf0f05f6f44321b97ab2dff8cda44c000000:39:396 [0] NCCL INFO 0 : NET/0 GPU/0 GPU/1 GPU/2 GPU/3 NET/0
e6bf0f05f6f44321b97ab2dff8cda44c000000:39:396 [0] NCCL INFO Pattern 3, crossNic 0, nChannels 0, speed 0.000000/0.000000, type NVL/PIX, sameChannels 1
e6bf0f05f6f44321b97ab2dff8cda44c000000:39:396 [0] NCCL INFO Tree 0 : -1 -> 0 -> 1/8/-1
e6bf0f05f6f44321b97ab2dff8cda44c000000:39:396 [0] NCCL INFO Tree 1 : 4 -> 0 -> 1/-1/-1
e6bf0f05f6f44321b97ab2dff8cda44c000000:39:396 [0] NCCL INFO Channel 00/02 : 0 1 2 3 4 5 6 7 8 9 10 11 12 13 14 15
e6bf0f05f6f44321b97ab2dff8cda44c000000:39:396 [0] NCCL INFO Channel 01/02 : 0 1 2 3 4 5 6 7 8 9 10 11 12 13 14 15
e6bf0f05f6f44321b97ab2dff8cda44c000000:39:396 [0] NCCL INFO Ring 00 : 15 -> 0 -> 1
e6bf0f05f6f44321b97ab2dff8cda44c000000:39:396 [0] NCCL INFO Ring 01 : 15 -> 0 -> 1
e6bf0f05f6f44321b97ab2dff8cda44c000000:39:396 [0] NCCL INFO Trees [0] 1/8/-1->0->-1 [1] 1/-1/-1->0->4
e6bf0f05f6f44321b97ab2dff8cda44c000000:39:396 [0] NCCL INFO Setting affinity for GPU 0 to 0fff
e6bf0f05f6f44321b97ab2dff8cda44c000000:39:396 [0] NCCL INFO Channel 00 : 15[85f000000] -> 0[13ff00000] [receive] via NET/Socket/0
e6bf0f05f6f44321b97ab2dff8cda44c000000:39:396 [0] NCCL INFO Channel 01 : 15[85f000000] -> 0[13ff00000] [receive] via NET/Socket/0
e6bf0f05f6f44321b97ab2dff8cda44c000000:39:396 [0] NCCL INFO Channel 00 : 0[13ff00000] -> 1[2ad700000] via direct shared memory
e6bf0f05f6f44321b97ab2dff8cda44c000000:39:396 [0] NCCL INFO Channel 01 : 0[13ff00000] -> 1[2ad700000] via direct shared memory
e6bf0f05f6f44321b97ab2dff8cda44c000000:39:396 [0] NCCL INFO Connected all rings
e6bf0f05f6f44321b97ab2dff8cda44c000000:39:396 [0] NCCL INFO Channel 01 : 0[13ff00000] -> 4[1f4000000] [send] via NET/Socket/0
e6bf0f05f6f44321b97ab2dff8cda44c000000:39:396 [0] NCCL INFO Channel 00 : 8[1e5b00000] -> 0[13ff00000] [receive] via NET/Socket/0
e6bf0f05f6f44321b97ab2dff8cda44c000000:39:396 [0] NCCL INFO Channel 00 : 0[13ff00000] -> 8[1e5b00000] [send] via NET/Socket/0
e6bf0f05f6f44321b97ab2dff8cda44c000000:39:396 [0] NCCL INFO Channel 01 : 4[1f4000000] -> 0[13ff00000] [receive] via NET/Socket/0
e6bf0f05f6f44321b97ab2dff8cda44c000000:39:396 [0] NCCL INFO Connected all trees
e6bf0f05f6f44321b97ab2dff8cda44c000000:39:396 [0] NCCL INFO threadThresholds 8/8/64 | 128/8/64 | 8/8/512
e6bf0f05f6f44321b97ab2dff8cda44c000000:39:396 [0] NCCL INFO 2 coll channels, 2 p2p channels, 1 p2p channels per peer
e6bf0f05f6f44321b97ab2dff8cda44c000000:39:396 [0] NCCL INFO comm 0x14d3a4001240 rank 0 nranks 16 cudaDev 0 busId 13ff00000 - Init COMPLETE
e6bf0f05f6f44321b97ab2dff8cda44c000000:39:39 [0] NCCL INFO Launch mode Parallel
[E ProcessGroupGloo.cpp:2789] [Rank 0]: Rank 4 failed to pass monitoredBarrier in 1800000 ms
[E ProcessGroupGloo.cpp:2789] [Rank 0]: Rank 5 failed to pass monitoredBarrier in 1800000 ms
[E ProcessGroupGloo.cpp:2789] [Rank 0]: Rank 6 failed to pass monitoredBarrier in 1800000 ms
[E ProcessGroupGloo.cpp:2789] [Rank 0]: Rank 7 failed to pass monitoredBarrier in 1800000 ms
[E ProcessGroupGloo.cpp:2789] [Rank 0]: Rank 8 failed to pass monitoredBarrier in 1800000 ms
[E ProcessGroupGloo.cpp:2789] [Rank 0]: Rank 9 failed to pass monitoredBarrier in 1800000 ms
[E ProcessGroupGloo.cpp:2789] [Rank 0]: Rank 10 failed to pass monitoredBarrier in 1800000 ms
[E ProcessGroupGloo.cpp:2789] [Rank 0]: Rank 11 failed to pass monitoredBarrier in 1800000 ms
[E ProcessGroupGloo.cpp:2789] [Rank 0]: Rank 12 failed to pass monitoredBarrier in 1800000 ms
[E ProcessGroupGloo.cpp:2789] [Rank 0]: Rank 13 failed to pass monitoredBarrier in 1800000 ms
[E ProcessGroupGloo.cpp:2789] [Rank 0]: Rank 14 failed to pass monitoredBarrier in 1800000 ms
[E ProcessGroupGloo.cpp:2789] [Rank 0]: Rank 15 failed to pass monitoredBarrier in 1800000 ms
[E ProcessGroupGloo.cpp:136] Ranks 4, 5, 6, 7, 8, 9, 10, 11, 12, 13, 14, 15 failed to pass monitoredBarrier in 1800000 ms
Traceback (most recent call last):
File "train.py", line 1569, in <module>
_runnetwork(epoch,trainingdata)
File "train.py", line 1528, in _runnetwork
loss.backward()
File "/opt/conda/lib/python3.8/site-packages/torch/_tensor.py", line 363, in backward
torch.autograd.backward(self, gradient, retain_graph, create_graph, inputs=inputs)
File "/opt/conda/lib/python3.8/site-packages/torch/autograd/__init__.py", line 173, in backward
Variable._execution_engine.run_backward( # Calls into the C++ engine to run the backward pass
RuntimeError: Ranks 4, 5, 6, 7, 8, 9, 10, 11, 12, 13, 14, 15 failed to pass monitoredBarrier in 1800000 ms
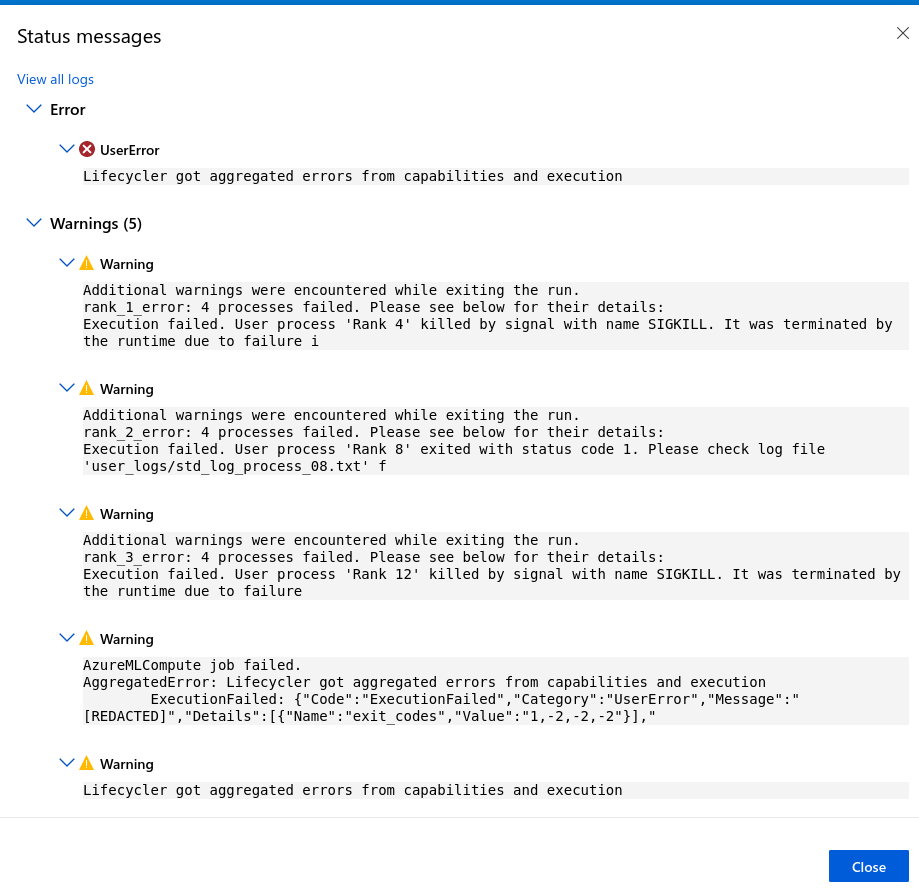
I see this error in Job Overview in Pipeline menu:
4 processes failed. Please see below for their details:
Execution failed. User process 'Rank 12' exited with status code 1. Please check log file 'user_logs/std_log_process_12.txt' for error details. Error: Traceback (most recent call last):
  File "train.py", line 1569, in <module>
    _runnetwork(epoch,trainingdata)
  File "train.py", line 1504, in _runnetwork
    output_belief, output_affinities = net(data)
  File "/opt/conda/lib/python3.8/site-packages/torch/nn/modules/module.py", line 1110, in _call_impl
    return forward_call(*input, **kwargs)
  File "/opt/conda/lib/python3.8/site-packages/torch/nn/parallel/distributed.py", line 962, in forward
    inputs, kwargs = self.to_kwargs(inputs, kwargs, self.device_ids[0])
  File "/opt/conda/lib/python3.8/site-packages/torch/nn/parallel/distributed.py", line 1086, in to_kwargs
    inputs = self._recursive_to(inputs, device_id) if inputs else []
  File "/opt/conda/lib/python3.8/site-packages/torch/nn/parallel/distributed.py", line 1080, in _recursive_to
    res = to_map(inputs)
  File "/opt/conda/lib/python3.8/site-packages/torch/nn/parallel/distributed.py", line 1059, in to_map
    return list(zip(*map(to_map, obj)))
  File "/opt/conda/lib/python3.8/site-packages/torch/nn/parallel/distributed.py", line 1044, in to_map
    stream = _get_stream(target_gpu)
  File "/opt/conda/lib/python3.8/site-packages/torch/nn/parallel/_functions.py", line 122, in _get_stream
    if _streams[device] is None:
IndexError: list index out of range

Execution failed. User process 'Rank 13' exited with status code 1. Please check log file 'user_logs/std_log_process_13.txt' for error details. Error: Traceback (most recent call last):
  File "train.py", line 1569, in <module>
    _runnetwork(epoch,trainingdata)
  File "train.py", line 1504, in _runnetwork
    output_belief, output_affinities = net(data)
  File "/opt/conda/lib/python3.8/site-packages/torch/nn/modules/module.py", line 1110, in _call_impl
    return forward_call(*input, **kwargs)
  File "/opt/conda/lib/python3.8/site-packages/torch/nn/parallel/distributed.py", line 962, in forward
    inputs, kwargs = self.to_kwargs(inputs, kwargs, self.device_ids[0])
  File "/opt/conda/lib/python3.8/site-packages/torch/nn/parallel/distributed.py", line 1086, in to_kwargs
    inputs = self._recursive_to(inputs, device_id) if inputs else []
  File "/opt/conda/lib/python3.8/site-packages/torch/nn/parallel/distributed.py", line 1080, in _recursive_to
    res = to_map(inputs)
  File "/opt/conda/lib/python3.8/site-packages/torch/nn/parallel/distributed.py", line 1059, in to_map
    return list(zip(*map(to_map, obj)))
  File "/opt/conda/lib/python3.8/site-packages/torch/nn/parallel/distributed.py", line 1044, in to_map
    stream = _get_stream(target_gpu)
  File "/opt/conda/lib/python3.8/site-packages/torch/nn/parallel/_functions.py", line 122, in _get_stream
    if _streams[device] is None:
IndexError: list index out of range

Execution failed. User process 'Rank 14' exited with s
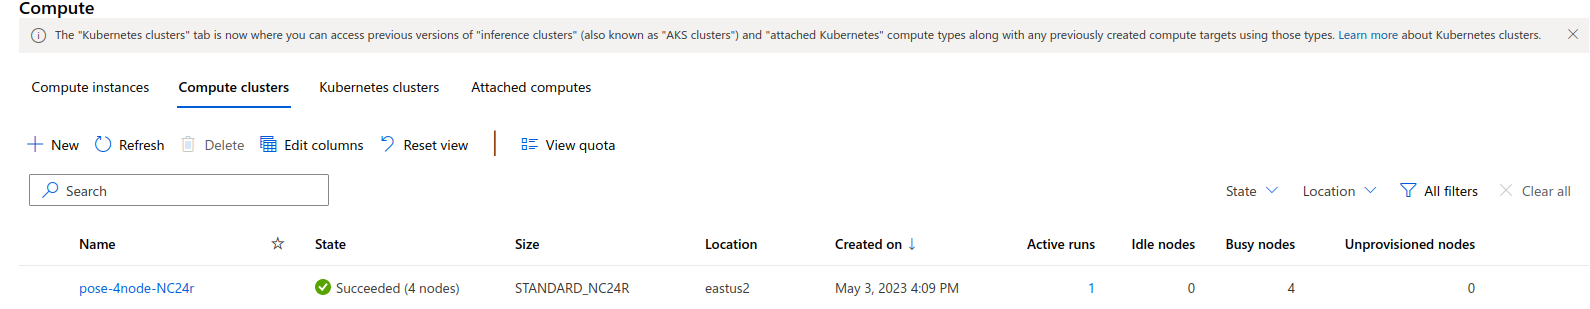
My cluster has 4 nodes and each node has 4 GPUs.


I am not sure which one of these is exactly correct but all three give errors:
# net = torch.nn.parallel.DistributedDataParallel(net, device_ids=[local_rank % torch.cuda.device_count()],
#                                                 output_device=local_rank % torch.cuda.device_count())
net = torch.nn.parallel.DistributedDataParallel(net, device_ids=[torch.distributed.get_rank()],
                                                output_device=torch.distributed.get_rank())
#net = torch.nn.parallel.DistributedDataParallel(net, device_ids=[local_rank]).to(local_rank) #which one is correct
Also, as for URL, I am not sure which one to exactly use, each throws a different error. I won’t know ahead of time who my master node is since I am using MLOps pipeline templates:
dist_url = "env://" # default
# dist_url = "auto"

is_distributed = world_size > 1

if is_distributed:
    batch_size = opt.batch_size // world_size
    batch_size = max(batch_size, 1)
else:
    batch_size = opt.batch_size

print("is_distributed is {} and batch_size is {}".format(is_distributed, batch_size))


env_dict = {
    key: os.environ[key]
    for key in ("MASTER_ADDR", "MASTER_PORT","LOCAL_RANK", "RANK", "WORLD_SIZE")
}
Here’s what the command is in train.yaml inside mlops --> azureml --> train folder.
command: >-
  python train.py
  --data ${{inputs.train_data}}
  $[[--batch_size ${{inputs.batch_size}}]]
  $[[--num_workers ${{inputs.num_workers}}]]
  $[[--prefetch_factor ${{inputs.prefetch_factor}}]]
  $[[--persistent_workers ${{inputs.persistent_workers}}]]
  $[[--pin_memory ${{inputs.pin_memory}}]]
  $[[--non_blocking ${{inputs.non_blocking}}]]
  $[[--model_arch ${{inputs.model_arch}}]]
  $[[--model_arch_pretrained ${{inputs.model_arch_pretrained}}]]
  $[[--num_epochs ${{inputs.num_epochs}}]]
  $[[--learning_rate ${{inputs.learning_rate}}]]
  --checkpoints ${{outputs.checkpoints}}
  $[[--register_model_as ${{inputs.register_model_as}}]]
  --enable_profiling ${{inputs.enable_profiling}}
  $[[--multiprocessing_sharing_strategy ${{inputs.multiprocessing_sharing_strategy}}]]

Can you please guide me how to fix this?