Ok, here’s the problem. First of all, this is a Fabric (/Lightning) problem with multi-GPU training. My code hangs upon reaching this line:
aNet,opt = fabric.setup( aNet,opt )
where aNet is a custom model, subclassing nn.Module as per the usual, and opt is defined thusly:
opt = torch.optim.Adam(
    aNet.parameters(), lr=lRate, eps=1e-08, foreach=True )
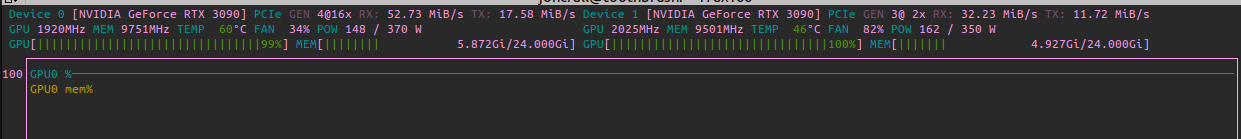
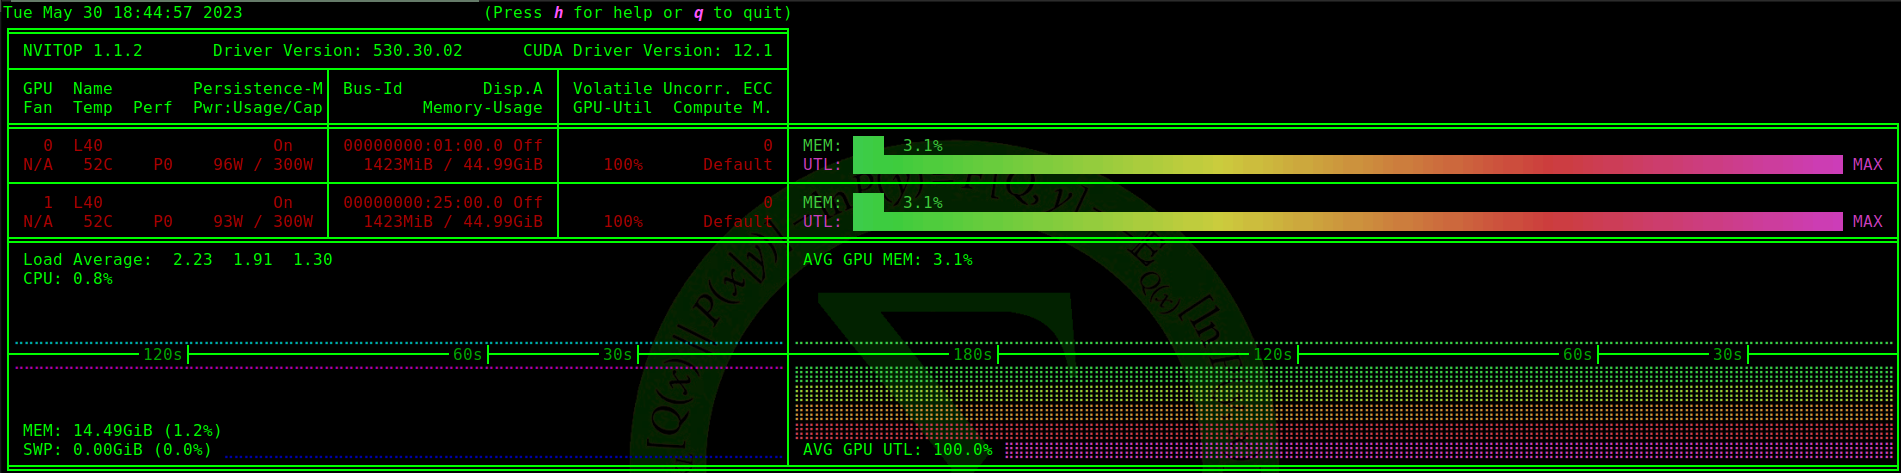
The following is what nvitop is showing when the fabric.setup line executes:
These lines are just before the one that causes the freeze, and they execute fine (don’t worry about what exactly the callback thing is - it’s not relevant here) :
nGPU = torch.cuda.device_count()
fabric = Fabric(
    accelerator='cuda', devices=nGPU, strategy="ddp", callbacks=[TM] )
fabric.launch()
Conda gives me the following when queried about currently installed version of cuda and pytorch:

I’m on pretty much the newest everything because I just completely re-created this env from the bottom up to address this issue, as I thought it was simply because my previous one wasn’t up to date. This is what I was previously running, which was giving me the exact same issue:

What’s odd is that this only happens when >1 GPUs are present, and only with some GPUs. As you can see from the first image, this machine is running two L40s. If I run only one L40, training proceeds just fine. So far, I’ve confirmed this problem to happen with the following GPUs: L40, RTX 6000 Ada, and A100 (PCIe and SXM) - all of these work totally fine if I’m only using one, but when >1 of any of these are present, all of them immediately jump to maxed-out GPU utilization when the offending line is reached. I’ve also confirmed that this issue doesn’t occur with: RTX 4090, RTX A6000, or RTX 3090, regardless of how many of them I’m running in parallel.
Any ideas? Happy to provide any more information needed or test on other machines.