I’m using a densenet121 for multilabel image classification.
Loss function is beta_score.
I used iterative stratification to balance distributions of multilabel data across splits for cross validation.
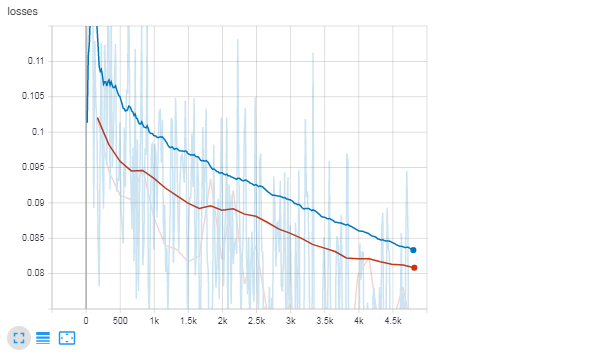
In the plot, the validation loss is lower than train loss.
I saw this link: https://www.pyimagesearch.com/2019/10/14/why-is-my-validation-loss-lower-than-my-training-loss/
They gave many reasons. But I’m still unsure.
And I guess I also don’t know if it’s something to be corrected.
I saw in https://machinelearningmastery.com/learning-curves-for-diagnosing-machine-learning-model-performance/ that if training loss is still decreasing than it means the model is underfitting.
I just want to make sure that this still holds true in my case (loss_train > loss_val)
This is a snapshot of the loss plot where blue is train and red is val.
I smoothed the plot (0,999).
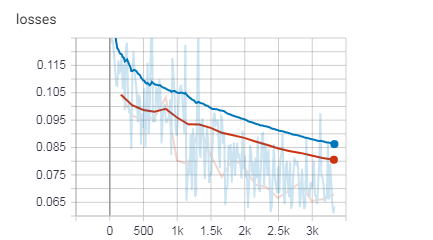
EDIT:
I deleted Dropout and added more epochs. But the plot shows the peak in the beginning. And I have no idea what it means.