Hi,
I was running the resnet 50 on DGX 4GPUs using pytorch imagenet examples. And I set the bucket_cap_mb=90 MB. So I guess the Backpropagation and All-Reduce will not be overlapped.
In my opinion, All-Reduce, Broadcast should launch similarly to all GPUs, but the visible Profile data is All-Reduce and Broadcast unsynced.
And Why two GPUs broadcast for a long time, And I want to know why GPUs call Broadcast.
In my opinion, All-Reduce, Broadcast should launch similarly to all GPUs, but the visible Profile data is All-Reduce and Broadcast unsynced.
The attached profile is not very clear so I’m not sure what sort of synchronization issue you’re referring to wrt to broadcast and all-reduce.
And Why two GPUs broadcast for a long time, And I want to know why GPUs call Broadcast.
There are a few scenarios where DDP performs a broadcast. First during initialization a broadcast is done to ensure all parameters on all nodes are the same before we start training. Secondly, if you’re using single process multi device mode (one process driving many GPUs) a broadcast is done to synchronize the parameters across multiple GPU devices.
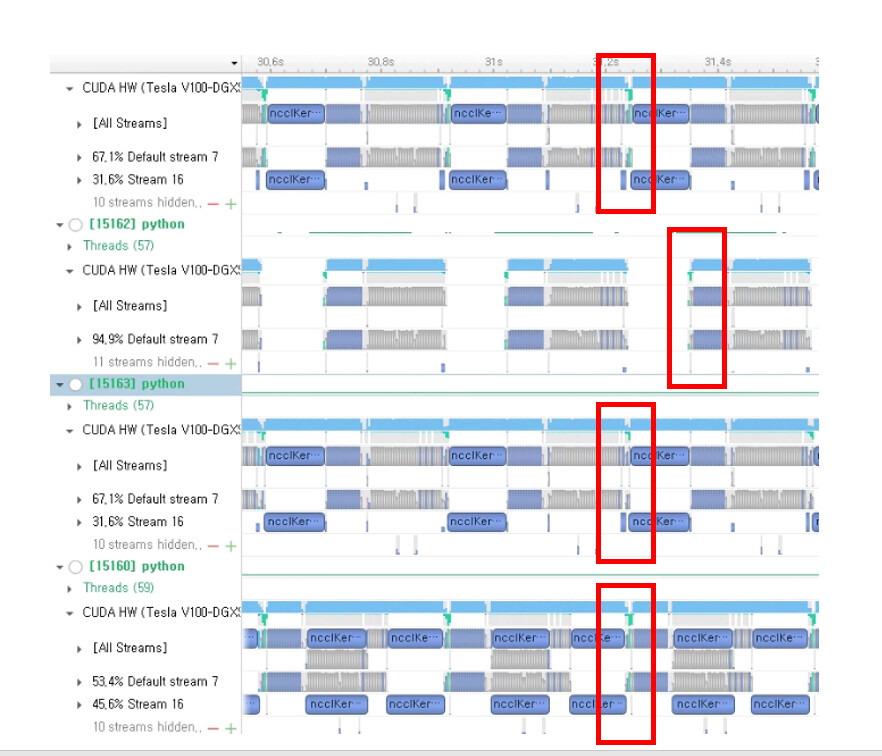
Now I guess very long allreduce and Broadcast which caused by late Memcpy H2D. If you see the above figure GPU 1,3,4 call the H2D(=green bar) at the similar time, but GPU 2 called the H2D at late. These unsync behavior make inefficient at multi-GPU training.
So all GPU sync on GPU2, can I solve this problem…? For example, I allocated the memcpyH2D to new stream or any nice idea…?
Hmm, do you know why GPU2 calls the H2D late? It seems like the GPU is idle for a while and calls H2D later. Is it possible the CPU thread was busy doing something else so it didn’t schedule the H2D call earlier? If you look at the CPU trace, it might give some idea about why the H2D copy was late for GPU2.
Does the profile have the ability to track when the copy kernel was actually launched on the CPU side? Can you check if the copy kernel itself was launched late or for some reason it was launched earlier but somehow execution got delayed on the GPU itself?
I found the solution. When I give the option of workers to 5. it was operated well i expected. My system has 1 node at 4GPU, so I gives workes=4 which affects the performance of other GPUs. I can’t find why DGX allocated more workers than other system. But I checked the profiler, it seems correct.
My concerns is more allocated the worker makes any other problem?
@sangheonlee Which API are you passing number of workers to? Is this a PyTorch API or some other API? If you’re running 5 workers on a 4 GPU system, what is the additional worker doing? I’m assuming the 4 workers are driving the 4 GPUs.
@pritamdamania87 I don’t know what additional worker doing exactly.
In previous, It will be enough 4 workers for 4 GPUs system. They cannot MemcpyH2D simultaneously. So I just added 1 more worker. Profiler shows what I expected…
Workers are passed to data loader I guess. If you see the PyTorch document, they told that worker is a sort of subprocess of data loader. So, I think it will not be any problem for performance comparison…
@sangheonlee Sorry to bother. I wonder which tools you use to profile nccl kernel in this post. I also want to profile multi-gpu training process, but I met some problems. Can you share how you get the profiled timeline? Thanks a lot!