Distributed training got stuck every few seconds

Hi, everyone
When I train my model with DDP, I observe that my training process got stuck every few seconds. The device information is shown in the following figure when it is stuck.


There seems always one GPU got stuck whose utilization is 0%, and the others are waiting for it to synchronizing.
This issue disappears after switching to another server (with the same image).
Though it is solved, I am curious about the reasons. I will appreciate it if someone shares the ideas.

Hi,
My experience with distributed training so far is quite limited so others might have better answers. But what I notice straight away is that some GPUs (e.g. number 3) are almost at full capacity, i.e. 11004/11019 and this might be causing problems. I had similar issues when running so close to capacity and found that reducing the batch size (perhaps together with using gradient accumulation) helped.
The reason could be some deadlock, where the code is waiting for data to come from all GPUs before moving onto the next step but one is unresponsive. Although it’s hard to guess without looking at the code. If reducing batch size (or increasing GPUs memory) doesn’t help, feel free to give more details and ideally attach a reproducible example and someone with more experience will take a look.

Hi Andrea,
Thanks for your reply.

  1. The causes seem not about large memory cost, because this issue happened to several models with different sizes.
  2. I think this issue is not related to my code, giving some code snippets might be a misleading instead. I use the standard code configuration which works fine several days ago and it indeed works fine in another server.

It’s really tricky to figure out the reasons for such a problem without applicable running environment. Thank you anyway.
Any other comments are definitely welcome!

1 Like

There seems always one GPU got stuck whose utilization is 0%, and the others are waiting for it to synchronizing.

Do you have uneven inputs? For example, you run one epoch every few seconds, and one partition on a rank has much fewer batches to process.

This issue disappears after switching to another server (with the same image).

Does the “image” here means cuda:6 still has 0 GPU utilization for some time, but you don’t feel it’s get stuck?

Thanks for reply.

  1. My data is uniformly partitioned to every GPUs.
  2. Sorry for the unclarity. “Image” here refer to as the docker image. Two machines share the same docker image, while only one of them works fine.

“Image” here refer to as the docker image. Two machines share the same docker image, while only one of them works fine.

That’s really weird, so the software setup should be exactly the same, and you also ran exactly the same code. Have you tried any different programs that can run on multiple GPUs? For example, another DDP training use case or just running some collective communication APIs like torch.distributed.all_reduce?

I am afraid that I may not be able to reproduce your issue on my own setup.

Thanks for your suggestions, and I will have a try.
I think this issue has something to do with my environment, where I observed some strange things. For example, another cuda error occurs in the same machine. Your comments about this cuda error are definitely welcome !!

The problem got more serious: several dataloaders got completely stuck, and the others are waiting for them.
I try print some information once the __getitem__ function is called.

    def __getitem__(self, idx):
        print(f'rank {torch.distributed.get_rank()}, fetch sample {idx}')
        # my custom transformations ...

After several iterations I got following information:

rank 4, fetch sample 1469
rank 2, fetch sample 3282
rank 5, fetch sample 2757
rank 1, fetch sample 1355
rank 3, fetch sample 279
rank 0, fetch sample 4107
rank 7, fetch sample 2834

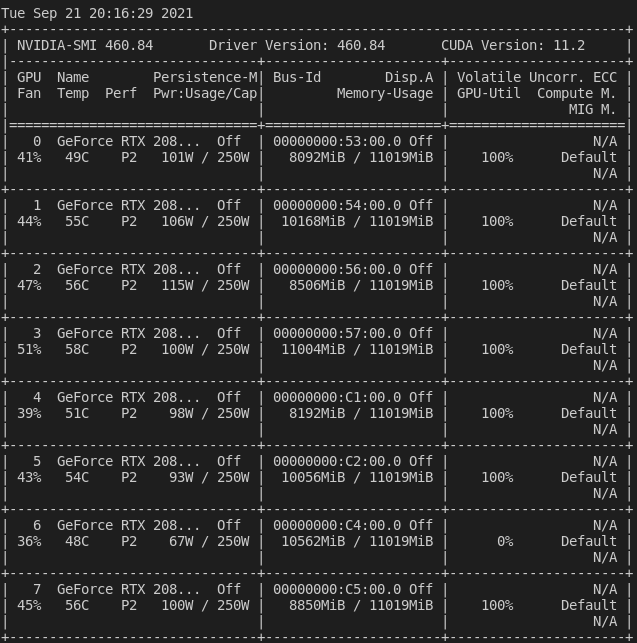
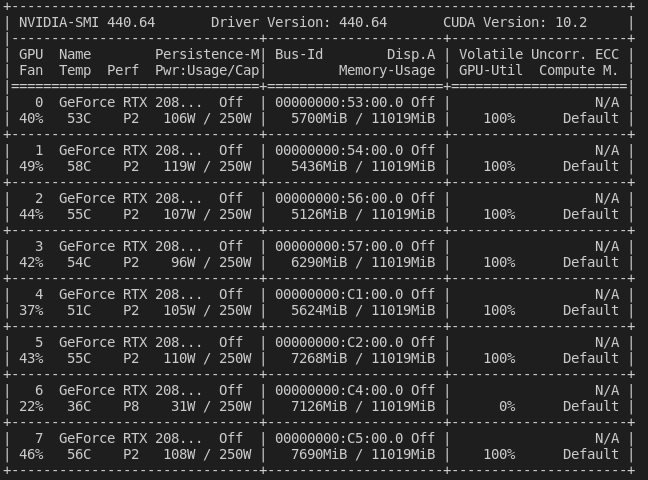
Rank 6 is missing, and the GPU information is as follows.
image

After sending an interrupt, the traceback is:

  File "/root/.pyenv/versions/3.6.8/lib/python3.6/site-packages/mmdet/apis/train.py", line 170, in train_detector
    runner.run(data_loaders, cfg.workflow)
  File "/root/.pyenv/versions/3.6.8/lib/python3.6/site-packages/mmcv/runner/epoch_based_runner.py", line 127, in run
    epoch_runner(data_loaders[i], **kwargs)
  File "/root/.pyenv/versions/3.6.8/lib/python3.6/site-packages/mmcv/runner/epoch_based_runner.py", line 47, in train
    for i, data_batch in enumerate(self.data_loader):
  File "/root/.pyenv/versions/3.6.8/lib/python3.6/site-packages/torch/utils/data/dataloader.py", line 521, in __next__
    data = self._next_data()
  File "/root/.pyenv/versions/3.6.8/lib/python3.6/site-packages/torch/utils/data/dataloader.py", line 1186, in _next_data
    idx, data = self._get_data()
  File "/root/.pyenv/versions/3.6.8/lib/python3.6/site-packages/torch/utils/data/dataloader.py", line 1152, in _get_data
    success, data = self._try_get_data()
  File "/root/.pyenv/versions/3.6.8/lib/python3.6/site-packages/torch/utils/data/dataloader.py", line 990, in _try_get_data
    data = self._data_queue.get(timeout=timeout)
  File "/root/.pyenv/versions/3.6.8/lib/python3.6/multiprocessing/queues.py", line 104, in get
    if not self._poll(timeout):
  File "/root/.pyenv/versions/3.6.8/lib/python3.6/multiprocessing/connection.py", line 257, in poll
    return self._poll(timeout)
  File "/root/.pyenv/versions/3.6.8/lib/python3.6/multiprocessing/connection.py", line 414, in _poll
    r = wait([self], timeout)
  File "/root/.pyenv/versions/3.6.8/lib/python3.6/multiprocessing/connection.py", line 911, in wait
    ready = selector.select(timeout)
  File "/root/.pyenv/versions/3.6.8/lib/python3.6/selectors.py", line 376, in select
    fd_event_list = self._poll.poll(timeout)
KeyboardInterrupt

Anyone has any idea? @wayi @AndreaSottana @ptrblck

Looks like uneven inputs for me.

Can you add no_sync context manager to disable allreduce in DDP?
https://pytorch.org/docs/stable/_modules/torch/nn/parallel/distributed.html#DistributedDataParallel.no_sync

This way you shouldn’t have any gradient synchronization, and you can check if this issue still occurs.

Another suggestion is enabling debug mode by:
os.environ["TORCH_DISTRIBUTED_DEBUG"] = "DETAIL"

Hi, I encounter a similar problem. Does yours be fixed?

Hi @fanl , I also met this issue. Have you addressed it? I really look forward to your help!

It is a very complicated problem. For me, the issue disappeared when I abandoned VSCode in the server, but it may not be the real cause. Hope it helps.

Very thanks for your reply! I am also using the server through VSCode. Let me have a try.