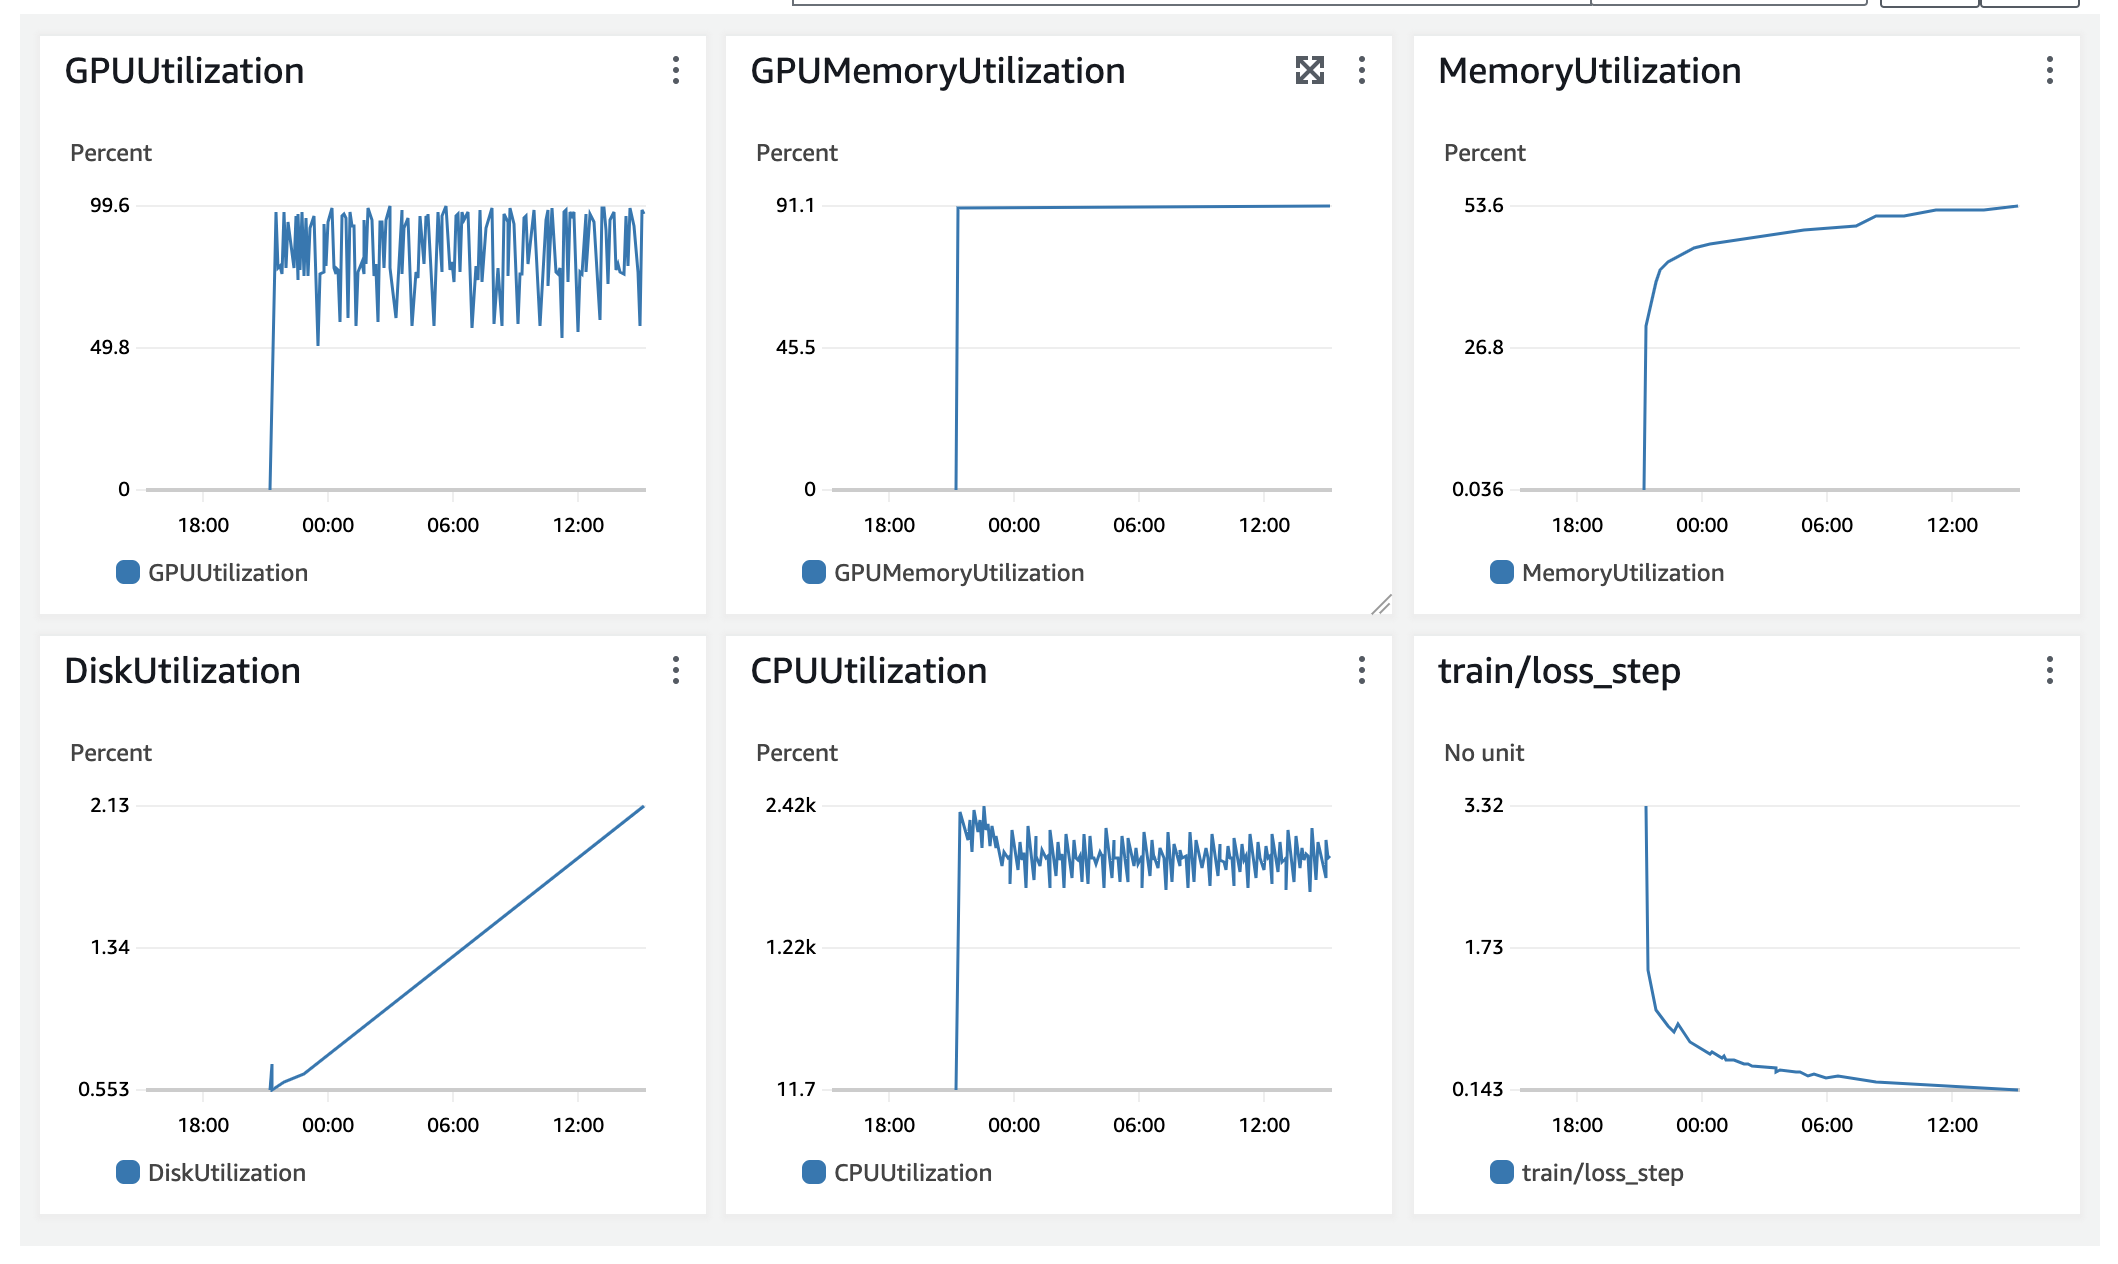
I am trying to detect a CPU “memory leak” . It don’t think it’s actual memory leak, but rather some design flow in my code. The CPU memory usage keeps growing a tiny bit every epoch, while the GPU memory usage is constant.
I used tracemalloc to compare two snapshots at epoch 30 and epoch 269, but it’s telling me that the line that caused the biggest memory increase is responsible only for 29.9 KiB. I don’t think that could be true as the memory used by my instance on AWS increased by a few gigabytes between these epochs.
What can I do to check what is causing the memory leak?
Here’s my code to collect memory snapshots:
import os
import pickle
import psutil
import tracemalloc

from pytorch_lightning.callbacks import Callback


class MemorySnapshotCallback(Callback):

    def __init__(self, output_dir_path: str):
        self.output_dir_path = output_dir_path
        os.makedirs(self.output_dir_path, exist_ok=True)
        tracemalloc.start()

    def on_train_epoch_end(self, trainer: 'pl.Trainer', pl_module: 'pl.LightningModule') -> None:
        # Acquire memory snapshot
        snapshot = tracemalloc.take_snapshot()
        # Log memory snapshot to file
        file_path = os.path.join(
            self.output_dir_path, f'memory_snapshot_after_epoch_{trainer.current_epoch}.snapshot'
        )
        with open(file_path, 'wb') as fp:
            pickle.dump(snapshot, fp)
        # Log memory usage
        trainer.logger.experiment.add_scalar(
            'Memory used', self.get_percentage_memory_used(), global_step=trainer.global_step
        )

    @staticmethod
    def get_percentage_memory_used() -> float:
        # Get the memory usage of the current process
        process = psutil.Process(os.getpid())
        memory_usage = process.memory_info().rss  # in bytes
        # Get the total memory of the machine
        total_memory = psutil.virtual_memory().total  # in bytes
        # Calculate the percentage of memory used
        percentage_memory_used = (memory_usage / total_memory) * 100
        return percentage_memory_used
Here’s my code to compare memory snapshots:
import pickle
import tracemalloc


snapshot_file_path_1 = '/Users/matteo/Downloads/memory/memory_snapshot_after_epoch_30.snapshot'
snapshot_file_path_2 = '/Users/matteo/Downloads/memory/memory_snapshot_after_epoch_267.snapshot'

with open(snapshot_file_path_1, 'rb') as fp:
    snapshot_1 = pickle.load(fp)

with open(snapshot_file_path_2, 'rb') as fp:
    snapshot_2 = pickle.load(fp)


top_stats = snapshot_2.compare_to(snapshot_1, 'lineno')
top_stats = sorted(top_stats, key=lambda stat: stat.size_diff, reverse=True)

print("[ Top 10 differences ]")
for stat in top_stats[:10]:
    print(stat)
Here’s the output of the code:
[ Top 10 differences ]
/usr/local/lib/python3.8/dist-packages/torch/_tensor.py:303: size=131 KiB (+29.9 KiB), count=1522 (+348), average=88 B
/usr/local/lib/python3.8/dist-packages/torch/serialization.py:577: size=119 KiB (+27.2 KiB), count=1522 (+348), average=80 B
/usr/lib/python3.8/posixpath.py:88: size=31.6 KiB (+25.7 KiB), count=289 (+237), average=112 B
/usr/local/lib/python3.8/dist-packages/torch/_tensor.py:309: size=43.8 KiB (+20.0 KiB), count=765 (+395), average=59 B
/usr/local/lib/python3.8/dist-packages/torch/_tensor.py:308: size=42.5 KiB (+19.9 KiB), count=738 (+393), average=59 B
/usr/local/lib/python3.8/dist-packages/pytorch_lightning/callbacks/model_checkpoint.py:635: size=18.8 KiB (+16.7 KiB), count=268 (+237), average=72 B
/usr/local/lib/python3.8/dist-packages/pytorch_lightning/callbacks/model_checkpoint.py:694: size=9544 B (+8136 B), count=2 (+0), average=4772 B
/usr/local/lib/python3.8/dist-packages/omegaconf/base.py:116: size=12.3 KiB (+5880 B), count=75 (+35), average=168 B
/usr/local/lib/python3.8/dist-packages/torch/optim/lr_scheduler.py:1578: size=6528 B (+5688 B), count=272 (+237), average=24 B
/usr/lib/python3.8/multiprocessing/queues.py:227: size=80.3 KiB (+5648 B), count=128 (+0), average=642 B
Thanks