I have a saved MLP model and I would to plot the weights of each layer, i.e. the connections from and to each neuron. I want each of these connections to be darker or lighter according to the weight magnitude.
I know there are tools that visualize the computation graph of a model, but are there tools that visualize the actual weight connections? Any examples using network x to draw a pytorch MLP model?
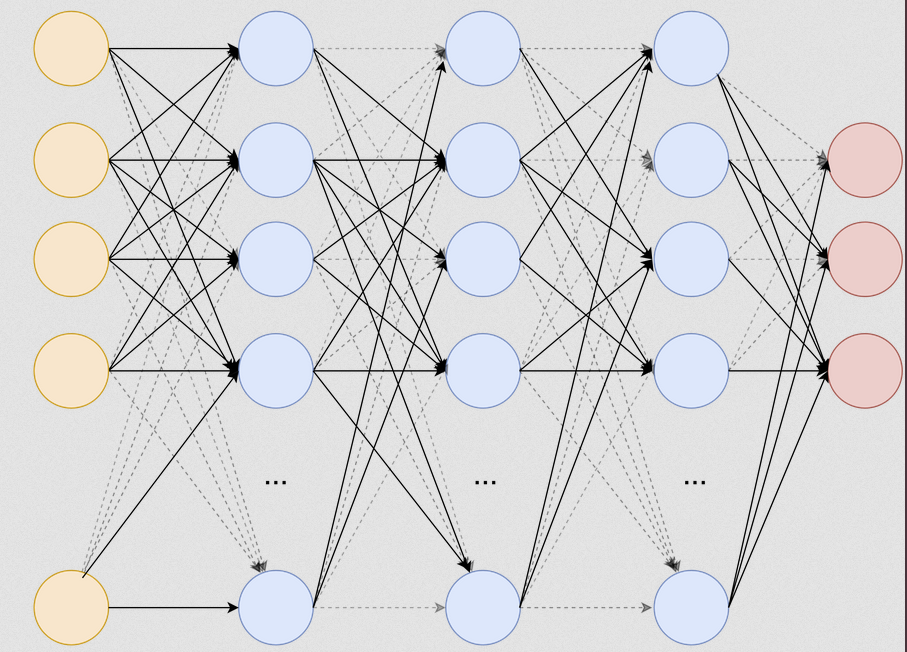
My end goal is something similiar to this, generated from a saved model: