Easiest way to draw training & validation loss

I would like to draw the loss convergence for training and validation in a simple graph. So far I found out that PyTorch doesn’t offer any in-built function for that yet (at least none that speaks to me as a beginner). I think it might be the best to just use some matplotlib code. I couldn’t figure out how exactly to do it though. I would be happy if somebody could give me hints how to incorporate the necessary code into my training & validation code:

def train_model(learning_rate, l2_penalty, epochs): 
    print(str(datetime.datetime.now()).split('.')[0], "Starting training and validation...\n")
    print("====================Data and Hyperparameter Overview====================\n")
    print("Number of training examples: %d, Number of validation examples: %d" %(len(training_dataframe), len(validation_dataframe)))
    print("Learning rate: %.5f, Embedding Dimension: %d, Hidden Size: %d, Dropout: %.2f, L2:%.10f\n" %(learning_rate, emb_dim, encoder.hidden_size, encoder.p_dropout, l2_penalty))
    print("================================Results...==============================\n")

    optimizer = torch.optim.Adam(dual_encoder.parameters(), lr = learning_rate, weight_decay = l2_penalty)#*
       
    loss_func = torch.nn.BCEWithLogitsLoss()
    loss_func.cuda()
     
    best_validation_accuracy = 0.0
     
    for epoch in range(epochs): 
                     
            shuffle_dataframe(training_dataframe)
                        
            sum_loss_training = 0.0
            
            training_correct_count = 0
            
            dual_encoder.train()

            for index, row in training_dataframe.iterrows():            
            
                context_ids, response_ids, label = load_ids_and_labels(row, word_to_id)
                
                context = autograd.Variable(torch.LongTensor(context_ids).view(-1,1), requires_grad = False).cuda()
                
                response = autograd.Variable(torch.LongTensor(response_ids).view(-1, 1), requires_grad = False).cuda()
                                
                label = autograd.Variable(torch.FloatTensor(torch.from_numpy(np.array(label).reshape(1,1))), requires_grad = False).cuda()
                             
                score = dual_encoder(context, response)
        
                loss = loss_func(score, label)
                
                sum_loss_training += loss.data[0]
                
                loss.backward()
        
                optimizer.step()
               
                optimizer.zero_grad()
                
                training_correct_count = increase_count(training_correct_count, score, label)
                                                    
            training_accuracy = get_accuracy(training_correct_count, training_dataframe)
                
            shuffle_dataframe(validation_dataframe)
            
            validation_correct_count = 0

            sum_loss_validation = 0.0

            dual_encoder.eval()

            for index, row in validation_dataframe.iterrows():
                
                context_ids, response_ids, label = load_ids_and_labels(row, word_to_id)
                
                context = autograd.Variable(torch.LongTensor(context_ids).view(-1,1)).cuda()
                
                response = autograd.Variable(torch.LongTensor(response_ids).view(-1, 1)).cuda()
                                
                label = autograd.Variable(torch.FloatTensor(torch.from_numpy(np.array(label).reshape(1,1)))).cuda()
                
                score = dual_encoder(context, response)
                
                loss = loss_func(score, label)
                
                sum_loss_validation += loss.data[0]
                
                validation_correct_count = increase_count(validation_correct_count, score, label)
                    
            validation_accuracy = get_accuracy(validation_correct_count, validation_dataframe)
                        
            print(str(datetime.datetime.now()).split('.')[0], 
                  "Epoch: %d/%d" %(epoch,epochs),  
                  "TrainLoss: %.3f" %(sum_loss_training/len(training_dataframe)), 
                  "TrainAccuracy: %.3f" %(training_accuracy), 
                  "ValLoss: %.3f" %(sum_loss_validation/len(validation_dataframe)), 
                  "ValAccuracy: %.3f" %(validation_accuracy))
            
            if validation_accuracy > best_validation_accuracy:
                best_validation_accuracy = validation_accuracy
                torch.save(dual_encoder.state_dict(), '/output/saved_model_%d_examples.pt' %(len(training_dataframe)))
                print("New best found and saved.")
                
    print(str(datetime.datetime.now()).split('.')[0], "Training and validation epochs finished.")
5 Likes

Try visdom! https://github.com/facebookresearch/visdom. Specifically vis.line.

3 Likes

Thanks, I will try that!

What’s the advantage of visdom compared with matplotlib please?

Visdom will create a small web application and send all plots to it, so that you can just let your model train on a server and see e.g. the loss curves, segmentation output etc. in your web browser.
Matplotlib will create the plots on your machine, which is sometimes not desired, e.g. if you just connect via SSH.

4 Likes

I think this tutorial is very useful for the task.
https://pytorch.org/tutorials/beginner/finetuning_torchvision_models_tutorial.html#model-training-and-validation-code

1 Like

In this example, why is the running loss multiplied by inputs.size(0)?

1 Like

I wrote livelossplot (live training loss plot in Jupyter Notebook for Keras, PyTorch and others) exactly for that purpose.

PyTorch example: https://github.com/stared/livelossplot/blob/master/examples/pytorch.ipynb

5 Likes

I concur with using visdom.

I recommend putting the code that handles drawing the visualizations in a different module for clarity, e.g.:

# module visualizations.py
from datetime import datetime
import visdom

class Visualizations:
    def __init__(self, env_name=None):
        if env_name is None:
            env_name = str(datetime.now().strftime("%d-%m %Hh%M"))
        self.env_name = env_name
        self.vis = visdom.Visdom(env=self.env_name)
        self.loss_win = None

    def plot_loss(self, loss, step):
        self.loss_win = self.vis.line(
            [loss],
            [step],
            win=self.loss_win,
            update='append' if self.loss_win else None,
            opts=dict(
                xlabel='Step',
                ylabel='Loss',
                title='Loss (mean per 10 steps)',
            )
        )

# module train.py
(...)

def train():
    (...)
    
    # Initialize the visualization environment
    vis = Visualizations()

    # Training loop
    loss_values = []
    for step, input in enumerate(loader):
        # Forward pass
        output = model(input)
        loss = model.loss(output)
        loss_values.append(loss.item())
    
        # Backward pass
        model.zero_grad()
        loss.backward()
        optimizer.step()
    
        # Visualization data
        if step % 10 == 0:
            vis.plot_loss(np.mean(loss_values), step)
            loss_values.clear()

Visdom is partially documented on its github page, and I found the demo they provide to answer a lot of my questions on the usage. For more complex plots, use matplotlib and embed them using vis.matplot.

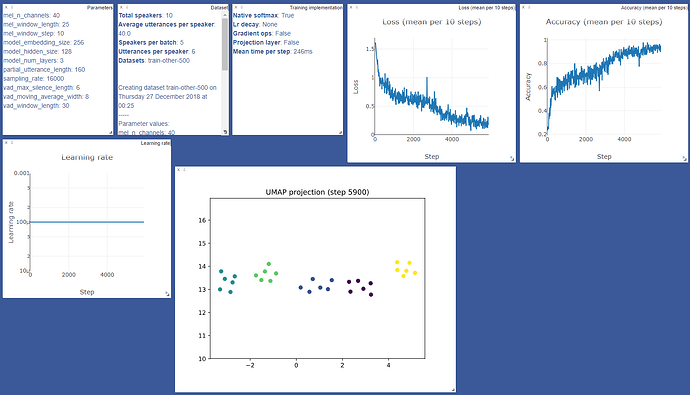
Here is an example of a visdom environment:

8 Likes

Hi. Is there a way to use Visdom in google colab?

I’m not sure, as I’m not using Colab that much.
However, you could have a look at this Visdom issue, so that the Visdom devs could also have a look. :wink:

Livelossplot was very helpful. It was exactly what I needed for my notebooks. I used it with both PyTorch and Keras and the usage was very straightforward.