Currently working on a multi-modal project, the model was first backboned by XLM-ROBERTA and ViT. The training process works out perfectly with about 2 hours/epoch. After a slight change in the model to fit CLIP with the same experiment settings (same workers, pin_memory=True…), everything went wrong. After debugging I found that the forward propagation process goes 4 times slower than XLM-ViT, low GPU-util and CPU-util were also found during the training process. I wonder how could this happen? Big thanks for any reply
GPU-util (8 cards with DDP and Apex AMP)spikes during the process, I think there might be some bottleneck but can’t figure out where it occurs.

It may be useful to instrument your workload with some simple timing instrumentation (even time.time() with appropriate torch.cuda.synchronize() calls could help) or use a profiler such as Nsight Systems (which may be a bit more heavyweight): Using Nsight Systems to profile GPU workload - hardware-backends / NVIDIA CUDA - PyTorch Dev Discussions.
Thank you for your kind advice.
I’ve tried using time.time() on the EXACT same roberta block to calculate the forward process and found almost every calculation step runs 10 times slower than before, I can’t figure out why.
Before:
qkv proj cost: 0.00046539306640625
qk matmul cost: 0.00012803077697753906
softmax cost: 5.3882598876953125e-05
dropout cost: 3.361701965332031e-05
value matmul cost: 0.00012302398681640625
After:
qkv proj cost: 0.009123563766479492
qk matmul cost: 0.0032358169555664062
softmax cost: 0.0007312297821044922
dropout cost: 1.0967254638671875e-05
value matmul cost: 0.0035011768341064453
Is this timing done with torch.cuda.synchronize() before timing starts and before it stops?
If that is the case I would check to make sure that expected invariants are indeed unchanged before and after the change (e.g., data layout, data type, and AMP settings). If it’s possible, I would try to profile just a small region of the model (e.g., qk matmul) to check that e.g., the same kernels are being called or that the same input shapes, and data types are used.
Thank you for replying!
Is this timing done with
torch.cuda.synchronize()before timing starts and before it stops?
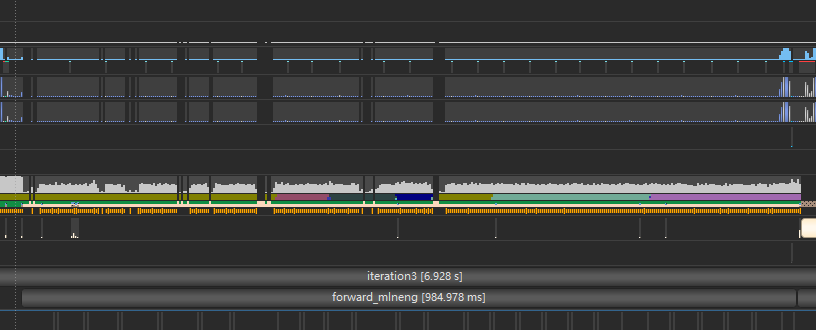
Yes, and I utilized Nsight for further investigation, I found that during the forward process, CPU kept on switching (shown as different color bars in Nsight) while CUDA HW (first row) remained low activity. I printed some of the outputs during the process and they were all on cuda, not CPU. I wonder how could this happens.
Again, thanks for helping.
At this stage I would pick a small portion of the workload and start timing individual calls or inserting NVTX ranges (with push and pop torch.cuda.nvtx.range_push — PyTorch 1.12 documentation torch.cuda.nvtx.range_pop — PyTorch 1.12 documentation) to see a more detailed breakdown is what is slowing down.
1 Like
Big thanks for your advice!
I eventually found the cause. I found torch.autograd.set_detect_anomaly(True) in my import lines and I made it folded and ignored ![]() . After deleting it everything goes as planned (What a stupid mistake) .
. After deleting it everything goes as planned (What a stupid mistake) .
Thank you again for helping!
1 Like