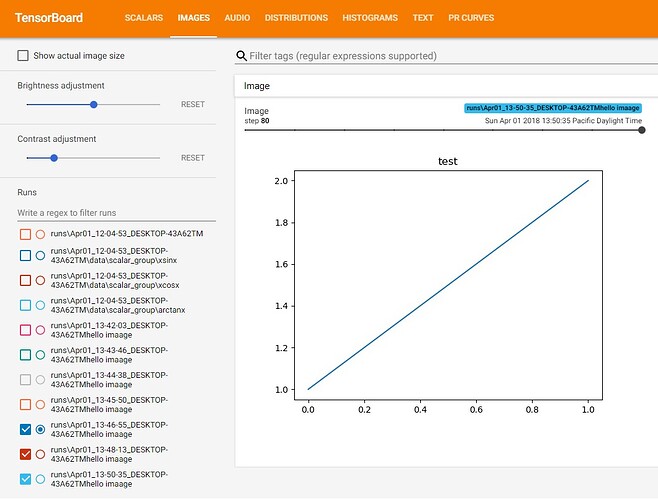
While working on timeseries data, wanted to save plots as images in tensorboard.
Here is the code.
import io
import matplotlib.pyplot as plt
from tensorboardX import SummaryWriter
import PIL.Image
from torchvision.transforms import ToTensor

def gen_plot():
    """Create a pyplot plot and save to buffer."""
    plt.figure()
    plt.plot([1, 2])
    plt.title("test")
    buf = io.BytesIO()
    plt.savefig(buf, format='jpeg')
    buf.seek(0)
    return buf


# Prepare the plot
plot_buf = gen_plot()

image = PIL.Image.open(plot_buf)
image = ToTensor()(image).unsqueeze(0)


writer = SummaryWriter(comment='hello imaage')
#x = torchvision.utils.make_grid(image, normalize=True, scale_each=True)
for n_iter in range(100):
    if n_iter % 10 == 0:
        writer.add_image('Image', image, n_iter)
