When trying to speed up my training Loop I’m seeing some weird behaviour. I’m using the new L4 GPUs on the google cloud platform, CUDA 12.1 and pytorch nigthly from today.
Training with mixed precision.
Dataloader uses 16 workers (which is needed to max out the GPU without compilation), with pin_memory = True.
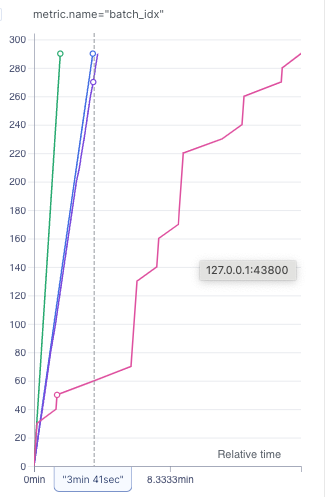
Graph shows training iteration over time.
Purple: No compilation, default dataloading.
Blue: No compilation, no dataloading (instead just computing on the same preloaded batch).
Barely any speedup, so dataloading does not seem to be the limiting factor.
Green: Compiled with mode=‘default’, no dataloading. Large speedup.
Pink: Compiled with mode=‘default’, default dataloading. Short bursts with the same speedup, but then large stretches where training slows down to a crawl and GPU usage breaks down.
Going from 16 to 32 CPUs does not solve the issue. So I would understand if dataloading is not able to serve at a high enough speed to max out the compile operation. But why does is slow down by a factor of 4 compared to no compilation?
I see the same behaviour with the nvidia T4 (though compile doesn’t give a speedup).