Hi!
I have some issues with optimisation of my code, as it seems to make a lot of unnecessary calls to python builtins.
I have implemented a game for the EGG framework like here: https://github.com/olipinski/EGG/blob/lmo/egg/zoo/lmo/.
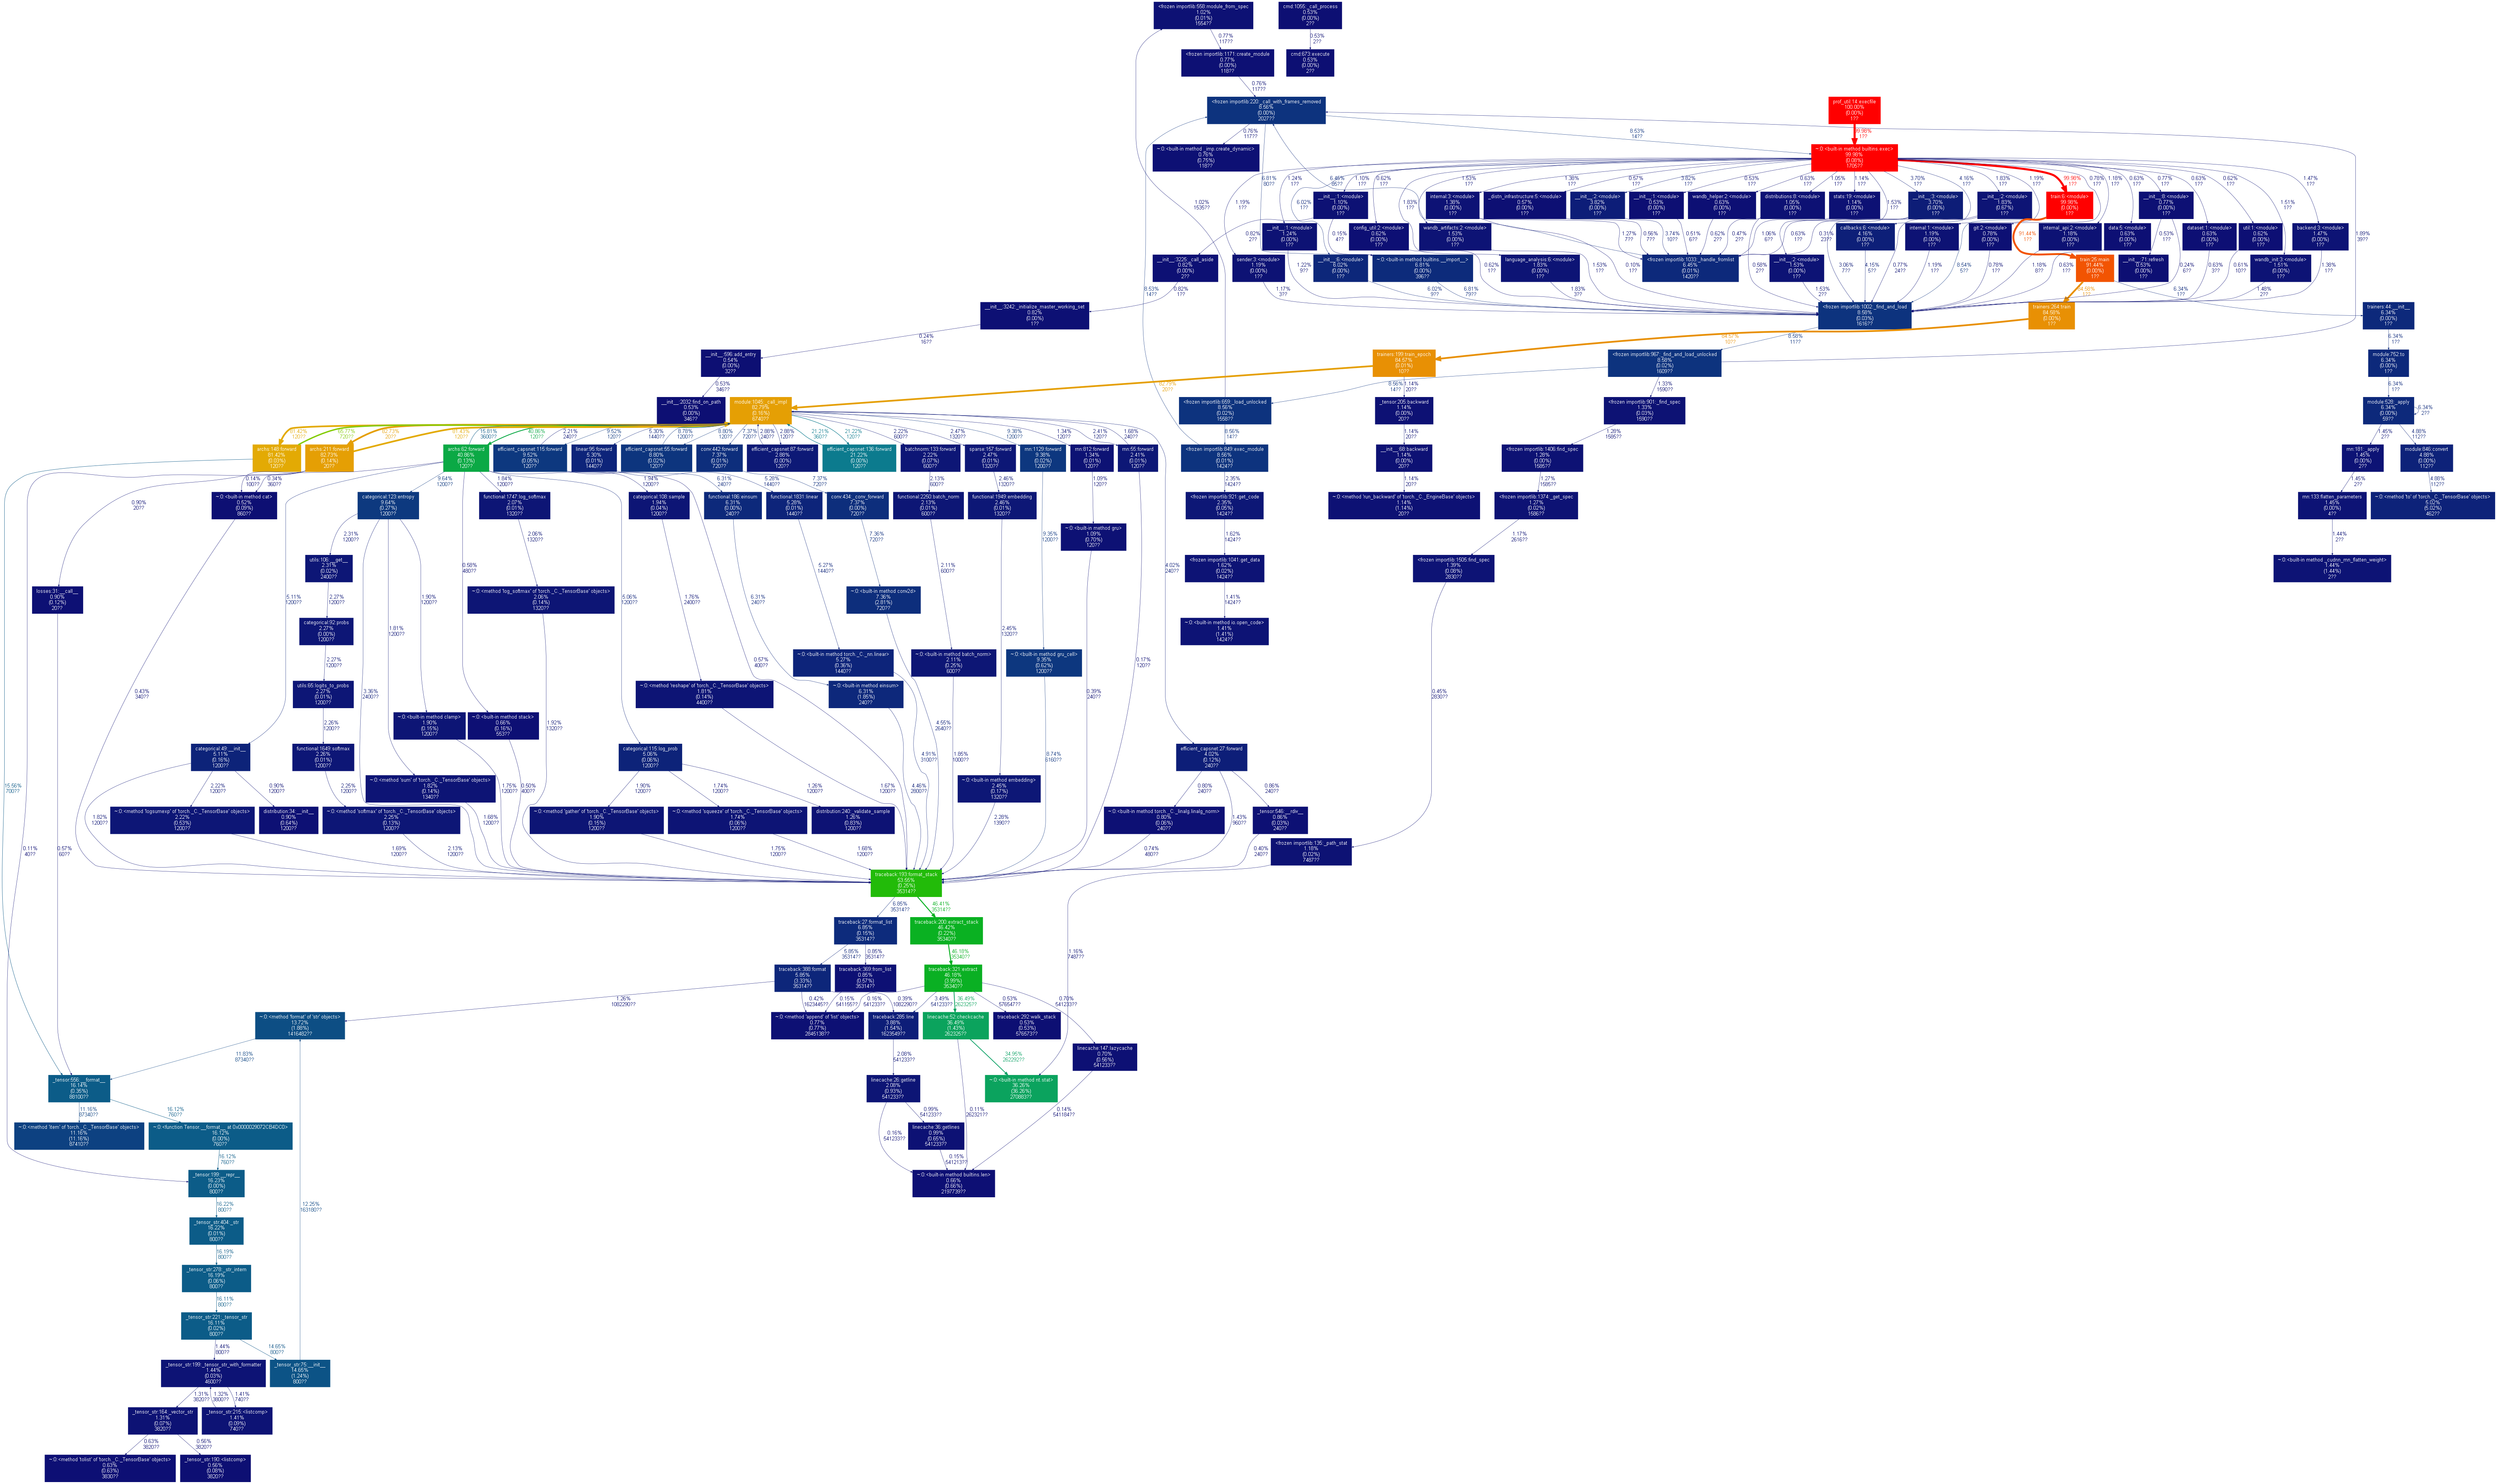
It appears that while the agent trains fine, there is a major bottleneck in terms of calls to nt.stat, traceback and linecache.
Would this be an issue with the data loader or something else? I have tried testing the data loader with just random torch tensors instead of reading from disk, but these calls still persist.
When the script is interrupted it usually appears to be doing exactly these calls, from seemingly random spots in the code:
Traceback (most recent call last):
  File "C:\Users\user\repos\EGG\egg\zoo\lmo\train.py", line 66, in <module>
    main(sys.argv[1:])
  File "C:\Users\user\repos\EGG\egg\zoo\lmo\train.py", line 55, in main
    trainer.train(n_epochs=opts.n_epochs)
  File "c:\users\user\repos\egg\egg\core\trainers.py", line 272, in train
    train_loss, train_interaction = self.train_epoch()
  File "c:\users\user\repos\egg\egg\core\trainers.py", line 215, in train_epoch
    optimized_loss, interaction = self.game(*batch)
  File "C:\Users\user\Anaconda3\envs\EGG\lib\site-packages\torch\nn\modules\module.py", line 1051, in _call_impl
    return forward_call(*input, **kwargs)
  File "c:\users\user\repos\egg\egg\zoo\lmo\archs.py", line 246, in forward
    pred, _, _, _ = self.receiver(receiver_input[b], sender_message)
  File "C:\Users\user\Anaconda3\envs\EGG\lib\site-packages\torch\nn\modules\module.py", line 1051, in _call_impl
    return forward_call(*input, **kwargs)
  File "c:\users\user\repos\egg\egg\zoo\lmo\archs.py", line 166, in forward
    message, log_prob_s, entropy_s = self.sender_module(im_hidden)
  File "C:\Users\user\Anaconda3\envs\EGG\lib\site-packages\torch\nn\modules\module.py", line 1051, in _call_impl
    return forward_call(*input, **kwargs)
  File "c:\users\user\repos\egg\egg\zoo\lmo\archs.py", line 77, in forward
    entropy.append(distr.entropy())
  File "C:\Users\user\Anaconda3\envs\EGG\lib\site-packages\torch\distributions\categorical.py", line 125, in entropy
    logits = torch.clamp(self.logits, min=min_real)
  File "C:\Users\user\Anaconda3\envs\EGG\lib\traceback.py", line 197, in format_stack
    return format_list(extract_stack(f, limit=limit))
  File "C:\Users\user\Anaconda3\envs\EGG\lib\traceback.py", line 211, in extract_stack
    stack = StackSummary.extract(walk_stack(f), limit=limit)
  File "C:\Users\user\Anaconda3\envs\EGG\lib\traceback.py", line 362, in extract
    linecache.checkcache(filename)
  File "C:\Users\user\Anaconda3\envs\EGG\lib\linecache.py", line 72, in checkcache
    stat = os.stat(fullname)
KeyboardInterrupt
The profiling gives the output as follows for no data loader workers:
--------------------------------------------------------------------------------
  Environment Summary
--------------------------------------------------------------------------------
PyTorch 1.9.0 DEBUG compiled w/ CUDA 11.1
Running with Python 3.9 and

`pip3 list` truncated output:
numpy==1.19.5
torch==1.9.0
torchaudio==0.9.0
torchinfo==1.5.2
torchvision==0.10.0
--------------------------------------------------------------------------------
  cProfile output
--------------------------------------------------------------------------------
         22712053 function calls (22595411 primitive calls) in 41.249 seconds

   Ordered by: internal time
   List reduced from 5852 to 15 due to restriction <15>

   ncalls  tottime  percall  cumtime  percall filename:lineno(function)
   350025   15.171    0.000   15.171    0.000 {built-in method nt.stat}
    84230    3.534    0.000    3.534    0.000 {method 'item' of 'torch._C._TensorBase' objects}
      762    3.262    0.004    3.262    0.004 {method 'to' of 'torch._C._TensorBase' objects}
    46046    1.818    0.000   19.818    0.000 C:\Users\user\Anaconda3\envs\EGG\lib\traceback.py:321(extract)
    46020    1.547    0.000    2.743    0.000 C:\Users\user\Anaconda3\envs\EGG\lib\traceback.py:388(format)
      300    1.080    0.004    2.917    0.010 {built-in method einsum}
      900    1.039    0.001    3.174    0.004 {built-in method conv2d}
1927073/1927069    0.786    0.000    4.536    0.000 {method 'format' of 'str' objects}
  2399744    0.721    0.000    1.733    0.000 C:\Users\user\Anaconda3\envs\EGG\lib\traceback.py:285(line)
   343146    0.605    0.000   15.433    0.000 C:\Users\user\Anaconda3\envs\EGG\lib\linecache.py:52(checkcache)
        2    0.512    0.256    0.512    0.256 {built-in method _cudnn_rnn_flatten_weight}
     1100    0.488    0.000    4.832    0.004 C:\Users\user\Anaconda3\envs\EGG\lib\site-packages\torch\_tensor_str.py:75(__init__)
      150    0.462    0.003    0.664    0.004 {built-in method gru}
   799958    0.442    0.000    0.890    0.000 C:\Users\user\Anaconda3\envs\EGG\lib\linecache.py:26(getline)
       50    0.398    0.008    0.398    0.008 {method 'run_backward' of 'torch._C._EngineBase' objects}


--------------------------------------------------------------------------------
  autograd profiler output (CPU mode)
--------------------------------------------------------------------------------
        top 15 events sorted by cpu_time_total

--------------------------------------  ------------  ------------  ------------  ------------  ------------  ------------
                                  Name    Self CPU %      Self CPU   CPU total %     CPU total  CPU time avg    # of Calls
--------------------------------------  ------------  ------------  ------------  ------------  ------------  ------------
    Optimizer.zero_grad#Adam.zero_grad         0.01%     150.300us        38.39%     604.538ms     604.538ms             1
                           aten::zero_        38.37%     604.250ms        38.37%     604.282ms     604.282ms             1
                          aten::select        25.56%     402.547ms        25.56%     402.548ms     402.548ms             1
                          aten::unbind         0.00%      40.100us        16.41%     258.457ms     258.457ms             1
                          aten::select         0.00%       5.600us        16.41%     258.367ms     258.367ms             1
                      aten::as_strided        16.41%     258.361ms        16.41%     258.361ms     258.361ms             1
                          aten::unbind         0.02%     258.600us         7.35%     115.775ms     115.775ms             1
                          aten::select         7.30%     115.001ms         7.30%     115.007ms     115.007ms             1
                          aten::unbind         0.03%     496.400us         4.74%      74.579ms      74.579ms             1
                          aten::select         4.64%      73.106ms         4.64%      73.113ms      73.113ms             1
                              aten::to         3.48%      54.846ms         3.50%      55.104ms      55.104ms             1
                         aten::__and__         0.00%       6.300us         2.80%      44.141ms      44.141ms             1
                     aten::bitwise_and         0.00%       6.600us         2.80%      44.135ms      44.135ms             1
                     aten::bitwise_and         2.80%      44.123ms         2.80%      44.126ms      44.126ms             1
                            aten::item         1.38%      21.694ms         1.38%      21.730ms      21.730ms             1
--------------------------------------  ------------  ------------  ------------  ------------  ------------  ------------
Self CPU time total: 1.575s

--------------------------------------------------------------------------------
  autograd profiler output (CUDA mode)
--------------------------------------------------------------------------------
        top 15 events sorted by cpu_time_total

        Because the autograd profiler uses the CUDA event API,
        the CUDA time column reports approximately max(cuda_time, cpu_time).
        Please ignore this output if your code does not use CUDA.

-----------------------  ------------  ------------  ------------  ------------  ------------  ------------  ------------  ------------  ------------  ------------
                   Name    Self CPU %      Self CPU   CPU total %     CPU total  CPU time avg     Self CUDA   Self CUDA %    CUDA total  CUDA time avg    # of Calls
-----------------------  ------------  ------------  ------------  ------------  ------------  ------------  ------------  ------------  ------------  ------------
            aten::zeros         0.00%      27.900us        38.68%     668.796ms     668.796ms       4.704us         0.00%       7.840us       7.840us             1
            aten::empty        38.67%     668.759ms        38.67%     668.759ms     668.759ms       0.000us         0.00%       0.000us       0.000us             1
       aten::is_nonzero        23.92%     413.616ms        23.93%     413.727ms     413.727ms       5.031us         0.00%     413.863ms     413.863ms             1
           aten::einsum         0.00%      60.600us        15.71%     271.608ms     271.608ms      12.829us         0.00%     279.063ms     279.063ms             1
              aten::sum         0.03%     534.700us        15.49%     267.932ms     267.932ms     279.036ms        60.37%     279.036ms     279.036ms             1
       aten::as_strided        15.46%     267.389ms        15.46%     267.389ms     267.389ms       0.000us         0.00%       0.000us       0.000us             1
    aten::masked_select         0.00%      52.600us        10.48%     181.211ms     181.211ms      13.874us         0.00%     181.664ms     181.664ms             1
          aten::nonzero         0.02%     295.000us        10.47%     181.130ms     181.130ms     181.619ms        39.30%     181.643ms     181.643ms             1
             aten::set_        10.46%     180.822ms        10.46%     180.822ms     180.822ms      24.576us         0.01%      24.576us      24.576us             1
           aten::unbind         0.08%       1.421ms         4.94%      85.501ms      85.501ms       1.440ms         0.31%      85.804ms      85.804ms             1
           aten::select         4.74%      81.937ms         4.74%      81.945ms      81.945ms       3.392us         0.00%       3.392us       3.392us             1
           aten::select         3.10%      53.629ms         3.10%      53.630ms      53.630ms       2.464us         0.00%       2.464us       2.464us             1
             aten::item         2.06%      35.549ms         2.07%      35.718ms      35.718ms       5.184us         0.00%     118.336us     118.336us             1
              aten::any         0.00%      46.700us         1.45%      25.117ms      25.117ms       8.160us         0.00%       8.160us       8.160us             1
            aten::empty         1.45%      25.055ms         1.45%      25.055ms      25.055ms       0.000us         0.00%       0.000us       0.000us             1
-----------------------  ------------  ------------  ------------  ------------  ------------  ------------  ------------  ------------  ------------  ------------
Self CPU time total: 1.729s
Self CUDA time total: 462.174ms
and this output for dataloader workers = 4:
--------------------------------------------------------------------------------
  Environment Summary
--------------------------------------------------------------------------------
PyTorch 1.9.0 DEBUG compiled w/ CUDA 11.1
Running with Python 3.9 and

`pip3 list` truncated output:
numpy==1.19.5
torch==1.9.0
torchaudio==0.9.0
torchinfo==1.5.2
torchvision==0.10.0
--------------------------------------------------------------------------------
  cProfile output
--------------------------------------------------------------------------------
         22745646 function calls (22629435 primitive calls) in 70.360 seconds

   Ordered by: internal time
   List reduced from 5992 to 15 due to restriction <15>

   ncalls  tottime  percall  cumtime  percall filename:lineno(function)
      596   28.683    0.048   28.683    0.048 {method 'acquire' of '_thread.lock' objects}
   350035   15.032    0.000   15.032    0.000 {built-in method nt.stat}
    84230    3.417    0.000    3.417    0.000 {method 'item' of 'torch._C._TensorBase' objects}
      102    2.869    0.028    2.869    0.028 {built-in method _winapi.WaitForSingleObject}
    46046    1.814    0.000   19.697    0.000 C:\Users\user\Anaconda3\envs\EGG\lib\traceback.py:321(extract)
      612    1.618    0.003    1.618    0.003 {method 'to' of 'torch._C._TensorBase' objects}
    46020    1.547    0.000    2.739    0.000 C:\Users\user\Anaconda3\envs\EGG\lib\traceback.py:388(format)
      900    0.972    0.001    3.143    0.003 {built-in method conv2d}
1927073/1927069    0.797    0.000    4.441    0.000 {method 'format' of 'str' objects}
  2399744    0.717    0.000    1.725    0.000 C:\Users\user\Anaconda3\envs\EGG\lib\traceback.py:285(line)
   343146    0.598    0.000   15.333    0.000 C:\Users\user\Anaconda3\envs\EGG\lib\linecache.py:52(checkcache)
      300    0.585    0.002    2.436    0.008 {built-in method einsum}
        2    0.486    0.243    0.486    0.243 {built-in method _cudnn_rnn_flatten_weight}
       42    0.485    0.012    0.485    0.012 {built-in method _winapi.CreateProcess}
     1100    0.481    0.000    4.713    0.004 C:\Users\user\Anaconda3\envs\EGG\lib\site-packages\torch\_tensor_str.py:75(__init__)


--------------------------------------------------------------------------------
  autograd profiler output (CPU mode)
--------------------------------------------------------------------------------
        top 15 events sorted by cpu_time_total

-------------------------------------------------------  ------------  ------------  ------------  ------------  ------------  ------------
                                                   Name    Self CPU %      Self CPU   CPU total %     CPU total  CPU time avg    # of Calls
-------------------------------------------------------  ------------  ------------  ------------  ------------  ------------  ------------
enumerate(DataLoader)#_MultiProcessingDataLoaderIter...         9.70%        2.859s         9.70%        2.859s        2.859s             1
enumerate(DataLoader)#_MultiProcessingDataLoaderIter...         9.66%        2.846s         9.66%        2.846s        2.846s             1
enumerate(DataLoader)#_MultiProcessingDataLoaderIter...         9.62%        2.834s         9.62%        2.834s        2.834s             1
enumerate(DataLoader)#_MultiProcessingDataLoaderIter...         9.47%        2.790s         9.47%        2.790s        2.790s             1
enumerate(DataLoader)#_MultiProcessingDataLoaderIter...         9.47%        2.789s         9.47%        2.789s        2.789s             1
enumerate(DataLoader)#_MultiProcessingDataLoaderIter...         9.44%        2.782s         9.44%        2.782s        2.782s             1
enumerate(DataLoader)#_MultiProcessingDataLoaderIter...         9.41%        2.771s         9.41%        2.771s        2.771s             1
enumerate(DataLoader)#_MultiProcessingDataLoaderIter...         9.37%        2.761s         9.37%        2.761s        2.761s             1
enumerate(DataLoader)#_MultiProcessingDataLoaderIter...         9.15%        2.697s         9.15%        2.697s        2.697s             1
enumerate(DataLoader)#_MultiProcessingDataLoaderIter...         9.04%        2.662s         9.04%        2.662s        2.662s             1
                                           aten::unbind         0.00%     266.600us         2.18%     642.036ms     642.036ms             1
                                           aten::select         2.18%     641.209ms         2.18%     641.231ms     641.231ms             1
                                          aten::__and__         1.38%     406.409ms         1.38%     406.422ms     406.422ms             1
enumerate(DataLoader)#_MultiProcessingDataLoaderIter...         1.13%     332.069ms         1.13%     332.070ms     332.070ms             1
enumerate(DataLoader)#_MultiProcessingDataLoaderIter...         0.99%     292.231ms         0.99%     292.232ms     292.232ms             1
-------------------------------------------------------  ------------  ------------  ------------  ------------  ------------  ------------
Self CPU time total: 29.465s

--------------------------------------------------------------------------------
  autograd profiler output (CUDA mode)
--------------------------------------------------------------------------------
        top 15 events sorted by cpu_time_total

        Because the autograd profiler uses the CUDA event API,
        the CUDA time column reports approximately max(cuda_time, cpu_time).
        Please ignore this output if your code does not use CUDA.

-------------------------------------------------------  ------------  ------------  ------------  ------------  ------------  ------------  ------------  ------------  ------------  ------------
                                                   Name    Self CPU %      Self CPU   CPU total %     CPU total  CPU time avg     Self CUDA   Self CUDA %    CUDA total  CUDA time avg    # of Calls
-------------------------------------------------------  ------------  ------------  ------------  ------------  ------------  ------------  ------------  ------------  ------------  ------------
enumerate(DataLoader)#_MultiProcessingDataLoaderIter...         9.82%        2.981s         9.82%        2.981s        2.981s       2.208us         0.00%       2.208us       2.208us             1
enumerate(DataLoader)#_MultiProcessingDataLoaderIter...         9.64%        2.926s         9.64%        2.926s        2.926s       2.656us         0.00%       2.656us       2.656us             1
enumerate(DataLoader)#_MultiProcessingDataLoaderIter...         9.62%        2.919s         9.62%        2.919s        2.919s       2.528us         0.00%       2.528us       2.528us             1
enumerate(DataLoader)#_MultiProcessingDataLoaderIter...         9.59%        2.910s         9.59%        2.910s        2.910s       3.328us         0.00%       3.328us       3.328us             1
enumerate(DataLoader)#_MultiProcessingDataLoaderIter...         9.52%        2.890s         9.52%        2.890s        2.890s       2.080us         0.00%       2.080us       2.080us             1
enumerate(DataLoader)#_MultiProcessingDataLoaderIter...         9.45%        2.868s         9.45%        2.868s        2.868s       2.080us         0.00%       2.080us       2.080us             1
enumerate(DataLoader)#_MultiProcessingDataLoaderIter...         9.42%        2.860s         9.42%        2.860s        2.860s       2.208us         0.00%       2.208us       2.208us             1
enumerate(DataLoader)#_MultiProcessingDataLoaderIter...         9.21%        2.796s         9.21%        2.796s        2.796s       2.624us         0.00%       2.624us       2.624us             1
enumerate(DataLoader)#_MultiProcessingDataLoaderIter...         9.01%        2.734s         9.01%        2.734s        2.734s       2.432us         0.00%       2.432us       2.432us             1
enumerate(DataLoader)#_MultiProcessingDataLoaderIter...         9.00%        2.732s         9.00%        2.732s        2.732s       2.048us         0.00%       2.048us       2.048us             1
                                           aten::unbind         0.00%     575.300us         2.16%     655.214ms     655.214ms     654.221ms        68.25%     654.857ms     654.857ms             1
                                           aten::select         2.15%     653.683ms         2.15%     653.684ms     653.684ms       2.496us         0.00%       2.496us       2.496us             1
                                        aten::embedding         1.47%     447.142ms         1.47%     447.196ms     447.196ms       4.672us         0.00%      12.896us      12.896us             1
enumerate(DataLoader)#_MultiProcessingDataLoaderIter...         1.09%     329.835ms         1.09%     329.836ms     329.836ms       2.240us         0.00%       2.240us       2.240us             1
enumerate(DataLoader)#_MultiProcessingDataLoaderIter...         1.00%     304.462ms         1.00%     304.464ms     304.464ms     304.369ms        31.75%     304.369ms     304.369ms             1
-------------------------------------------------------  ------------  ------------  ------------  ------------  ------------  ------------  ------------  ------------  ------------  ------------
Self CPU time total: 30.353s
Self CUDA time total: 958.624ms
Here is how to reproduce my issues:
To run the code you would also need to install ShapeWorld - GitHub - AlexKuhnle/ShapeWorld
The whole thing can be run with the following command. It will also create the dataset of size 10.
python egg/zoo/lmo/train.py --vocab_size 6 --batch_size 2 --max_len 10 --dataset-size 10 --n_epochs 10 --dataset-create --dataset-overwrite
and then to profile:
python -m torch.utils.bottleneck egg/zoo/lmo/train.py --vocab_size 6 --batch_size 2 --max_len 10 --dataset-size 10 --n_epochs 10
I will be extremely grateful for any pointers as to what might be causing this issue!