This is the output of a single profiler, run like below. So to me, it seems that it’s either unfiltered even on a single profiler, or an actual issue.
This is how I ran the profiler:
python -m cProfile -o test.pstats .\egg\zoo\lmo\train.py --vocab_size 6 --batch_size 5 --max_len 10 --dataset-size 10 --n_epochs 10
I am just surprised to see these calls, since they do not show up on any other profiler runs I have tried on different modules in the framework.
For example, when profiling the basic channel game
python -m cProfile -o test.pstats egg/zoo/channel/train.py --vocab_size=3 --n_features=6 --n_epoch=50 --max_len=10 --batch_size=512 --random_seed=21 --batches_per_epoch 2
The call graph does not include these calls.
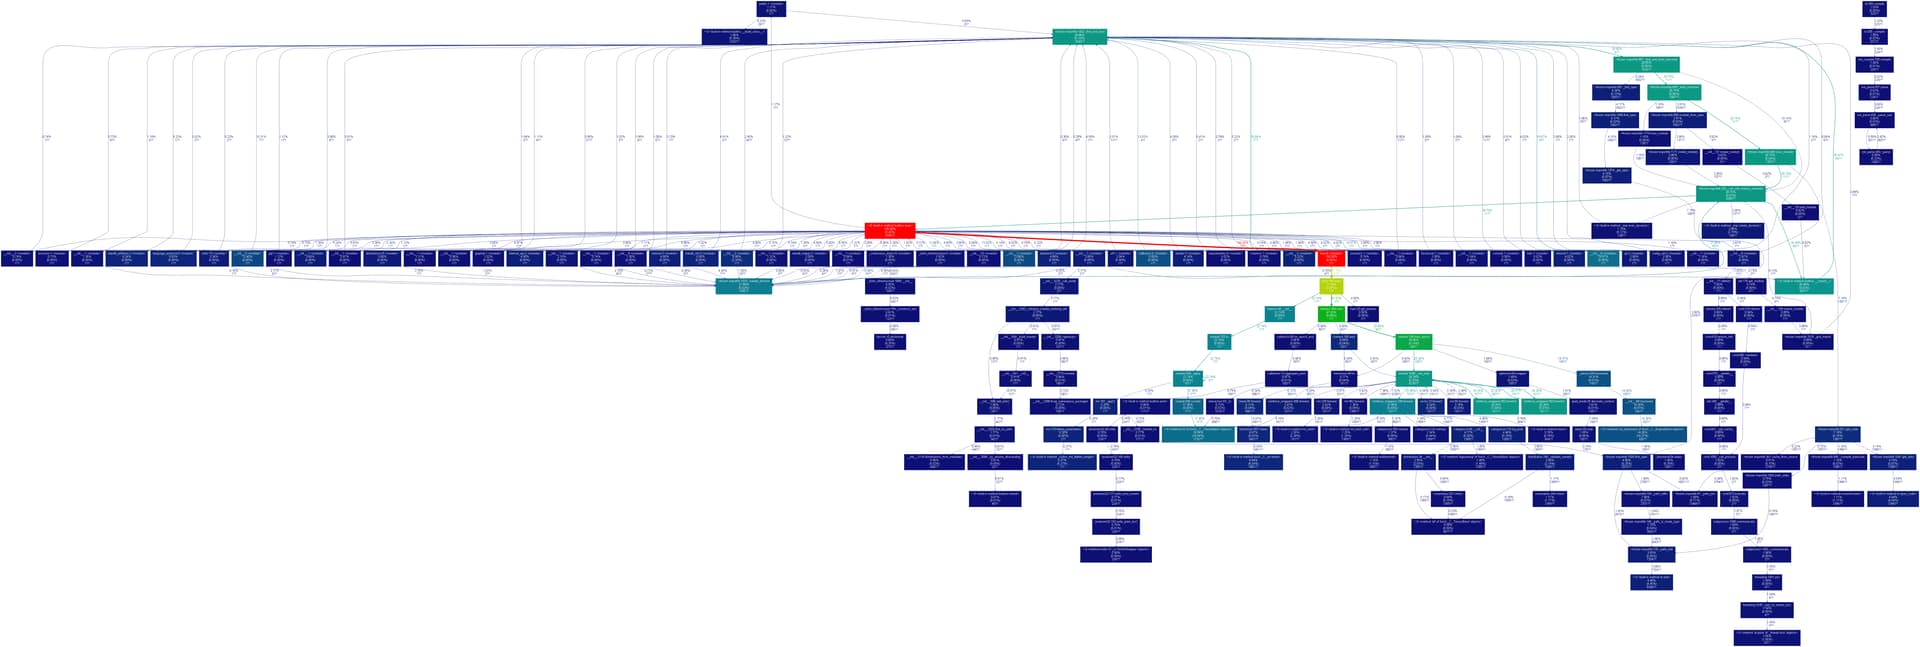
My main concern is, that at least from those graphs, it looks like a lot of compute is being wasted on calls that are not needed, and so are slowing down training.
Let me know what you think! Should I just ignore the additional traceback calls?