Hi @ptrblck, I am currently having the GPU memory leakage problem (during evaluation) that
(1) the GPU memory usage increased during evaluation, and
(2) it is not fully cleared after all variables have been deleted, and i have also cleared the memory using torch.cuda.empty_cache() and gc.collect().
Do you have any idea on why the GPU remains occupied after the evaluation stage? and this problem occurs even if I set the batch size to 1.
My evaluation function is as follows:
 with torch.no_grad():

        for batch_idx, (x, y) in enumerate(loader_gallery):

            x = x.to(device)

            x, xx = model(x)
            xx = submodel(xx)

            gallery_fea_1 = torch.cat((gallery_fea_1, x.cpu()), 0)
            gallery_fea_2 = torch.cat((gallery_fea_2, xx.cpu()), 0)
            gallery_label = torch.cat((gallery_label, y.cpu()), 0)

            del x, xx, y
            time.sleep(0.0001)
Could you describe the “memory leak” a bit more?
Are you seeing an increase in memory usage in the Windows task manager after executing the training and validation loop, which is approx. constant afterwards or is the memory increasing in each iteration until you run out of memory?
The former could be expected, if you are keeping objects alive from the training loop and if the validation loop needs to allocate additional memory.
PyTorch uses a custom caching allocator, which will keep the already allocated memory in the cache and will not release it for performance reasons.
Calling empty_cache won’t avoid any out of memory issues, will slow down your code, and is useful if you want to release the cache so that other processes could use it.
I encountered this problem in the evaluation mode (prior to training), and the GPU memory remains “constantly occupied” even after the evaluation has been completed.
I am finding ways to release this “occupied” GPU memory so that the training mode is executed without any GPU memory shortage issue.
And this problem only occurs if the pre-trained ResNet50 is used. Is that bcoz of the model complexity where a large portion of the GPU memory is allocated and kept in the cache even in the evaluation mode?
Unfortunately, I still don’t understand the issue correctly. Are you running out of memory during training or are you concerned about the memory cache (which will reuse memory as described before)?
I apologize for the umbiguities. In fact, I am having problems during both training and testing.
(1) Due to the reason that I am using a pre-learned modal, my practice is that I first ran in the evaluation mode (with some probing data) before training started to check for the initial performance.
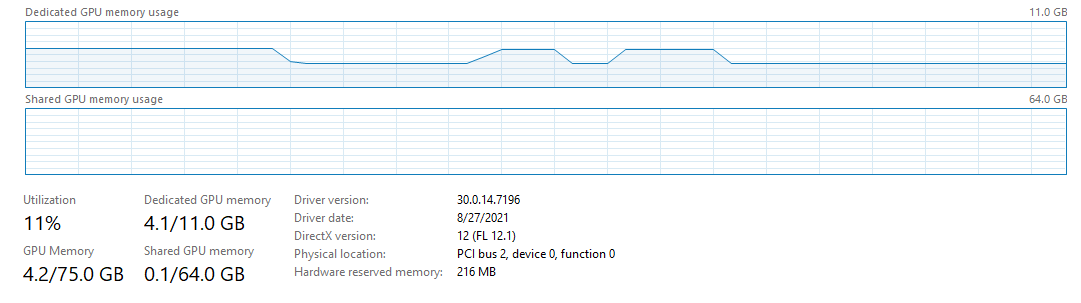
(2) I found that the GPU memory allocated for evaluation couldn’t be cleared (about 4G memory being occupied as illustated in the figure). This causes the memory shortage issue during training even if I set the batch size to only 16.
(3) I am wondering if the the pre-allocated memory for the evaluation mode can be cleared for training purposes?
This is expected, since the memory would be in the cache assuming that you have deleted all tensors. If not delete objects, which are not needed anymore.
I assume that you’ve verified this claim by running the training without a previous evaluation and this setup worked fine?