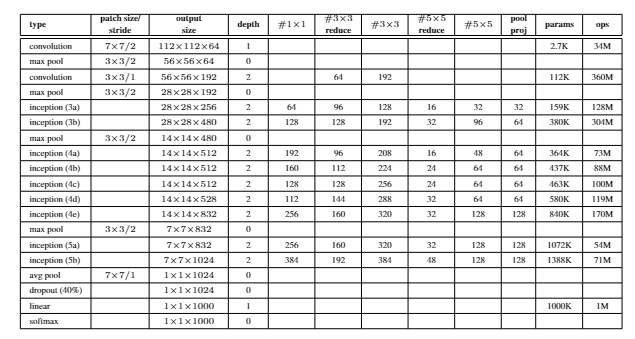
I need Help to vizualice the layers activations on my Googlenet model, i need something like the following image:

Honestly i don’t know what else can i do.
It is a pretrained model i only have 2 classes and it is a local dataset :
model = models.googlenet(pretrained=True)
loss_fn=nn.CrossEntropyLoss()
optimizer=optim.Adam(model.parameters(), lr=learning_rate)
this i how i train my model for training :
train_accu= []

train_losses=[]

def train(epoch):
  print('\nEpoch : %d'%epoch)

  model.train()

  running_loss=0
  correct=0
  total=0

  for batch_idx, (data, targets) in tqdm(enumerate(train_loader)):

    #inputs,labels=data[0].to(device),data[1].to(device)

    inputs = data.to(device=device,dtype=torch.float)
    labels = targets.to(device=device)

    optimizer.zero_grad()
    global outputs
    outputs=model(inputs)
    loss=loss_fn(outputs,labels)
    loss.backward()
    optimizer.step()

    running_loss += loss.item()

    _, predicted = outputs.max(1)
    total += labels.size(0)
    correct += (predicted == labels).sum().item()

  train_loss=running_loss/len(train_loader)
  accu=100.*correct/total

  train_accu.append(accu)
  train_losses.append(train_loss)
  print('Train Loss: %.3f | Accuracy: %.3f'%(train_loss,accu))
All the Layers:
and if you need more info here is the link of the model because i can not copy all the layer here, i do not have enough space
If anyone could help me I would really appreciate it a lot