Hi, I want to optimize the transfer time of data from GPU to CPU. I am using RTX 3060 with a CPU of i7-10700. First I check the bandwidth of Cuda tensor to pinned-memory CPU tensor on c++ using the code in this blog (https://developer.nvidia.com/blog/how-optimize-data-transfers-cuda-cc/). It is 12.33 GB/s, which is reasonable. Then I check the transfer time of my python code shown below.
sample_number = 65
imgs_display = torch.zeros([sample_number,800,1280],dtype = torch.uint8,device='cuda')
imgData = torch.zeros(sample_number*800*1280,dtype = torch.uint8,device='cpu',pin_memory = True)
time_count = np.zeros(n_iter)
for n in range(n_iter):
    # here I hide the code for updating the imgs_display matrix based on the feedback
    torch.cuda.synchronize()
    start = time.perf_counter()
    imgData.copy_(imgs_display.flatten())
    torch.cuda.synchronize()
    time_count[n] = time.perf_counter()-start
    # here I hide the code for projecting the generated image patterns and getting the feedback signal
I notice that if I comment the code for projecting images, the transfer time in each iteration is about 0.0053 s. The size of imgs_display is 66 MB and then the transfer speed is about 12.45 GB/s. matching the bandwidth measured in the benchmark. If I run the code for the first time (which means there is no warmup), the value is higher (0.02 s) at first. This high value at the beginning will disappear after I run it again.
Then, if I add the code for projecting images after transferring, the transfer speed is much slower. To mimic this situation, I use time.sleep() and the code is shown below:
imgs_display = torch.zeros([sample_number,800,1280],dtype = torch.uint8,device='cuda')
imgData = torch.zeros(sample_number*800*1280,dtype = torch.uint8,device='cpu',pin_memory = True)
time_count = np.zeros(n_iter)
for n in range(n_iter):
    # here I hide the code for updating the imgs_display matrix based on the feedback
    torch.cuda.synchronize()
    start = time.perf_counter()
    imgData.copy_(imgs_display.flatten())
    torch.cuda.synchronize()
    time_count[n] = time.perf_counter()-start
    time.sleep(0.02)
Here is the result for sleep time of 0, 0.02, 0.05 s:
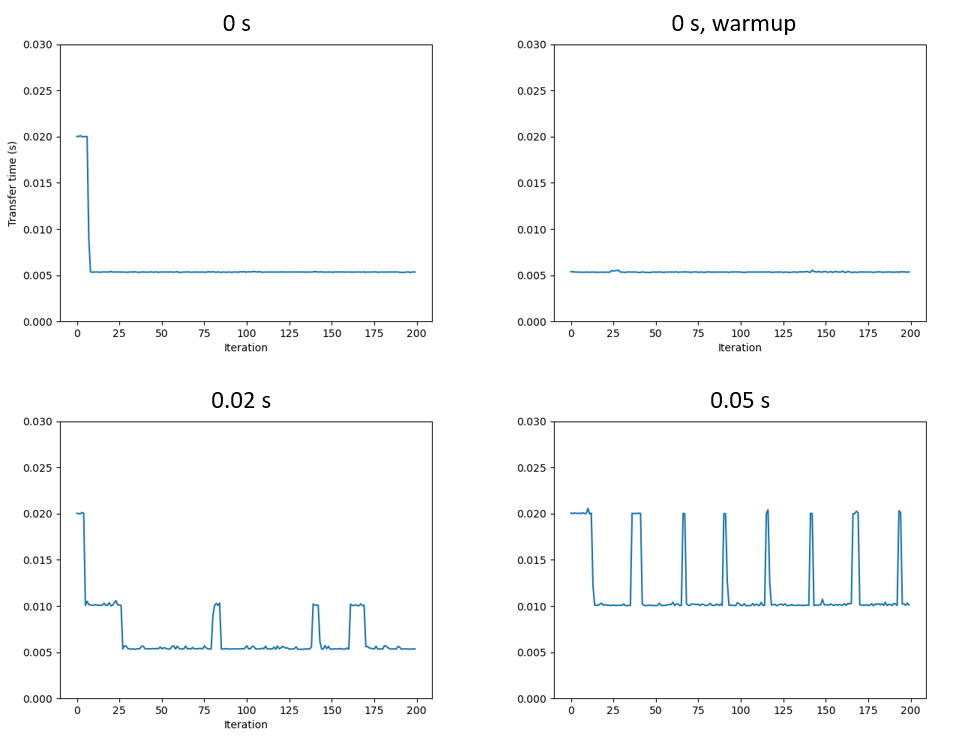
For time.sleep longer than 0.1 s, it is always 0.02 s:
Given these observations, I have the following questions:
- From the fact the transfer speed is related to the sleep time during iteration, I assume it is caused by warmup, but which part is causing this problem? The temperature or something else?
- In the real experiment, the kernel need to wait for the detector to get the feedback signal, and the time is not negligible (~0.1 s per iteration). Then the transfer time is almost four times larger than the one without sleep time. Is there anything I can do in order to keep the high transfer speed measured in the benchmark? I am wondering if I should find a way to keep GPU busy during the data acquisition time…
Thank you in advance!