Gpu memory leak on torch.cat


                                               Name    Self CPU %      Self CPU   CPU total %     CPU total  CPU time avg       CPU Mem  Self CPU Mem      CUDA Mem  Self CUDA Mem    # of Calls  

                                      aten::resize_         0.10%      69.000us         0.10%      69.000us       8.625us           0 b           0 b       4.74 Gb       4.74 Gb             8  
                                          aten::cat         0.04%      27.000us         0.22%     159.000us      39.750us           0 b           0 b       4.73 Gb           0 b             4  
                                         aten::_cat         0.08%      60.000us         0.19%     132.000us      33.000us           0 b           0 b       4.73 Gb           0 b             4  
                               attention_embedding2         0.13%      90.000us         0.74%     523.000us     523.000us          -4 b          -4 b       4.71 Gb           0 b             1  
                                          aten::mul         0.18%     129.000us         0.23%     162.000us      23.143us           0 b           0 b       1.57 Gb       1.57 Gb             7  
                               attention_embedding1         0.08%      54.000us         0.16%     112.000us     112.000us          -4 b          -4 b       1.56 Gb           0 b             1  
                                        aten::empty         0.70%     498.000us         0.70%     498.000us       4.835us       2.19 Kb       2.19 Kb     235.99 Mb     235.99 Mb           103  
                                         aten::lstm         0.15%     109.000us        92.66%      65.808ms      16.452ms           0 b           0 b      94.76 Mb           0 b             4  
                                   aten::_cudnn_rnn        35.10%      24.929ms        92.45%      65.656ms      16.414ms           0 b           0 b      94.76 Mb    -135.34 Mb             4  
                                   output_embedding         0.54%     380.000us        14.40%      10.229ms      10.229ms          -4 b        -372 b      58.78 Mb     -31.27 Mb             1  

I reimplemented Bidaf by myself.
I’ve been having trouble dealing with GPU memory leak

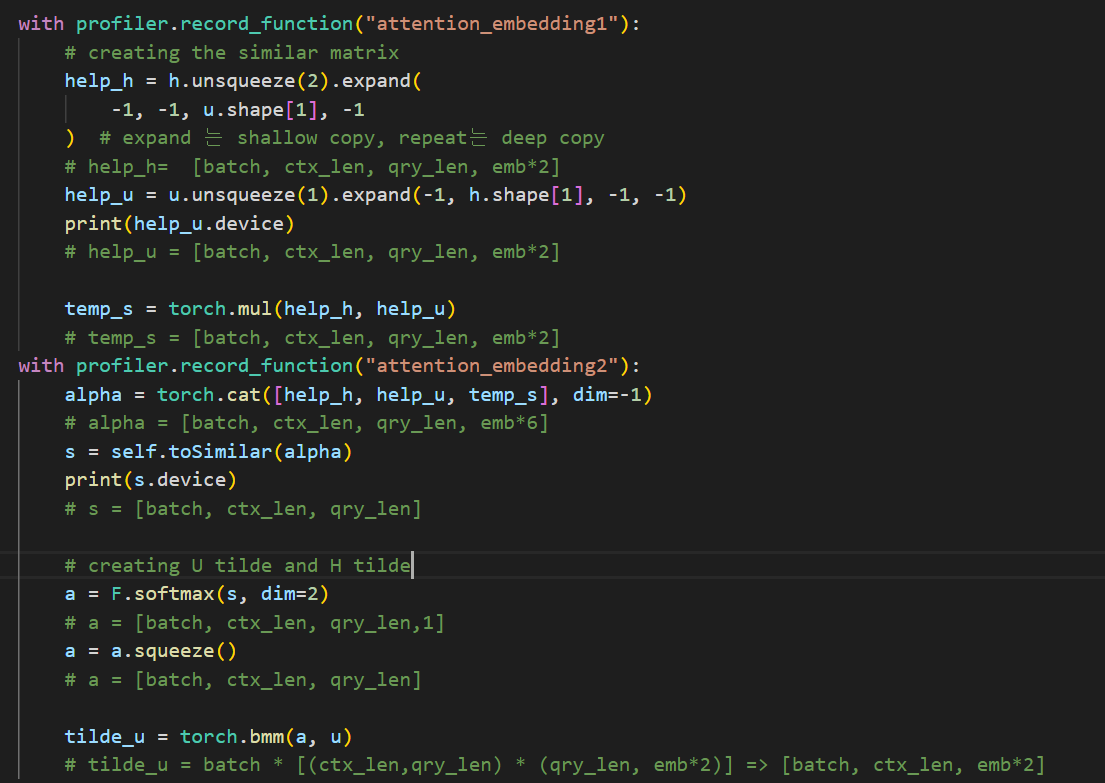
The first image I attached is the codes inside model’s forward function
The table is created by pytorch profiler.

Only a few codes occupy 4GB memory, especially torch.cat.

I’ve been trying to look up the solution to fix it, I haven’t made it.

Is there anyone who knows how to fix it??

Could you explain a bit more why you conclude that torch.cat is leaking memory?
Since torch.cat will create a new tensor, new GPU memory allocation is expected, but it seems as if you are losing memory (leaking) and run eventually into an OOM using torch.cat?

To prevent the model from running into OOM, I set the batch size = 8, instead of using a baseline batch size =60.

Only one torch.cat operation uses 4GB memory looks like there is something wrong.

just so you know : help_h, help_u, temp_s have about (8, 200,100,200) shape

That sounds strange and I cannot reproduce the issue as I get the expected 2x increase:

x1 = torch.randn(8, 200, 100, 200, device='cuda')
x2 = torch.rand_like(x1)
x3 = torch.rand_like(x1)

print(torch.cuda.memory_allocated() / 1024**3)
# 0.35762786865234375

y = torch.cat((x1, x2, x3), dim=-1)
print(torch.cuda.memory_allocated() / 1024**3)
# 0.7152557373046875

I just tried your code and as you said, cat operation doesn’t exceed 1GB.

So, it still remains a mystery. I mean, PyTorch profiler showed me the table and it said 4.74GB is allocated at this operation…

any idea that I should check other things?

I’m not sure if the profiler reporting might be misleading, but are you seeing the same allocations using my code snippet in the profiler?

yes, I confirmed it
the profiler repoting might be wrong, but probably not since I suffer from unexpected GPU memory usage.

According to the original paper and other re-implementation, this model uses under 12gb gpu memory at batch size=60.

But mine uses 14gb at only batch size = 8

I’ve read this discussion talking about torch.cat and linear layer(you answered)

import torch
from torch import nn

x1 = torch.randn(8, 200, 100, 200, device="cuda")

x2 = torch.rand_like(x1)

x3 = torch.rand_like(x1)

print(torch.cuda.memory_allocated() / 1024 ** 3)

# 0.35762786865234375

y = torch.cat((x1, x2, x3), dim=-1)

print(torch.cuda.memory_allocated() / 1024 ** 3)

# 0.7152557373046875

print(y.device)

print(y.shape)

temp = nn.Linear(600, 1)

temp.cuda(0)

print(y.device, x1.device, x2.device, x3.device)

k = temp(y)

print(k.shape)

print(torch.cuda.memory_allocated() / 1024 ** 3)

# 0.73

I reused your code to check if the linear layer is the cause, but it wasn’t.

I feel like I’ve tried almost everything to solve this problem. :sob:

It seems the original issues is:

If so, could you add the debug print statements to different parts of the code (e.g. after model init, after the foward, after backward, after step() etc.) to see how much memory is used in each step and where the unexpected memory growth might be coming from?