I have been developing the following library: GraSS/_GradComp/attributor/attributor.py at main · TRAIS-Lab/GraSS · GitHub for a while, and I have ran into a weird GPU memory leak problem on large-scale experiments (specifically, 8B model with 1B token dataset). Let me briefly summarize what this library is trying to do to give some context:
cache_gradient(inbase.py): compute per-sample gradients for train dataloader. No memory leakage for this step.compute_preconditioner: load all per-sample gradients, compute their (layer-wise) outer product and sum them over. At the end, compute their inverses, i.e., preconditioners. See some memory build-up but not significant enough to cause OOM.compute_ifvp: compute the matrix-vector products between the preconditioners (step 2) with the per-sample gradients (step 1). See some memory build-up but not significant enough to cause OOM.attribute: compute per-sample gradients for test dataloader first, and compute all pair-wise inner products between these test per-sample gradients and preconditioned train per-sample gradient (step 3). This step will cause OOM.
If you look into the code, you’ll find that with offload=disk (i.e., I’ll save/load every gradient/ifvp/preconditioners to/from disk), ideally the code should only occupied a fixed amount of memory since nothing is kept in the memory: I move all the results to cpu followed by a save request, or in the case of loading from disk, it is just prefetching with the dataloader. All actual computations on GPU are fixed size (only a small batches of the entire dataset is loaded) and are simple operations (matrix multiplications).
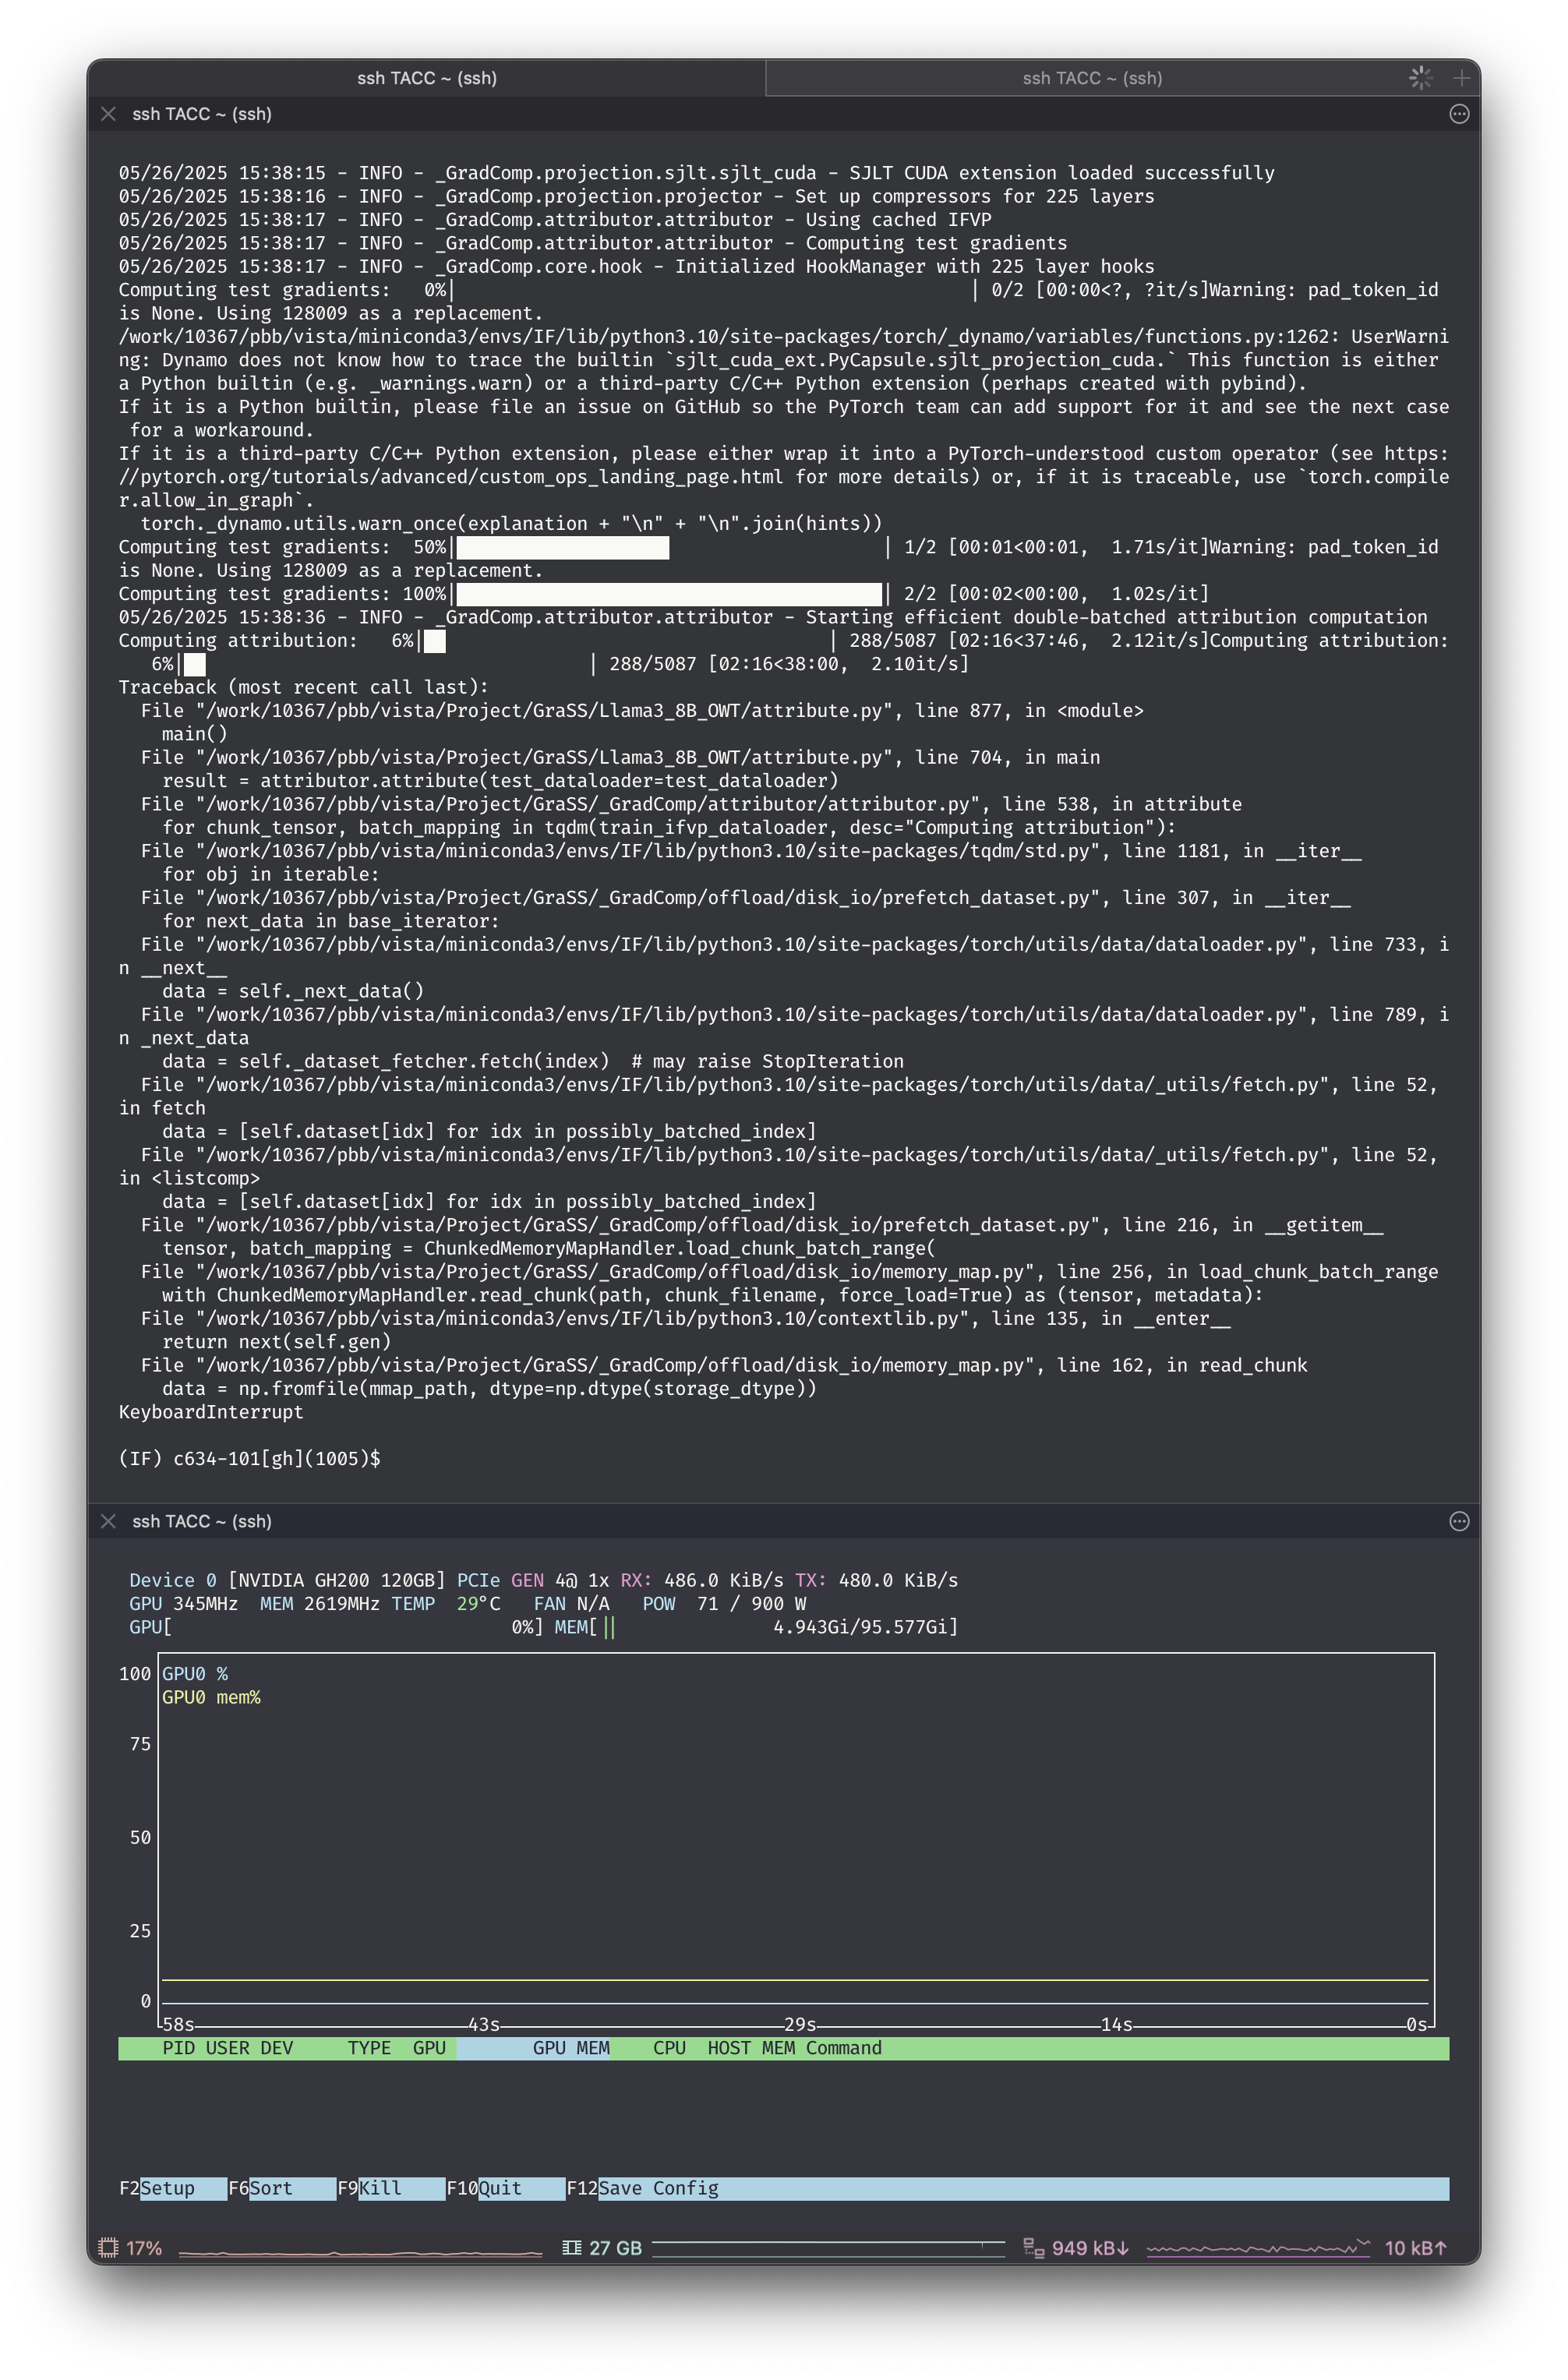
However, what happened in practice is that the memory built up slowly, and eventually cause OOM in some cases. Another weird thing is that when the task ends (either by keyboard interruption or OOM), there is still some memory occupied on GPU. For instance, this is what happened when I run attribute for a while and then kill the job manually:
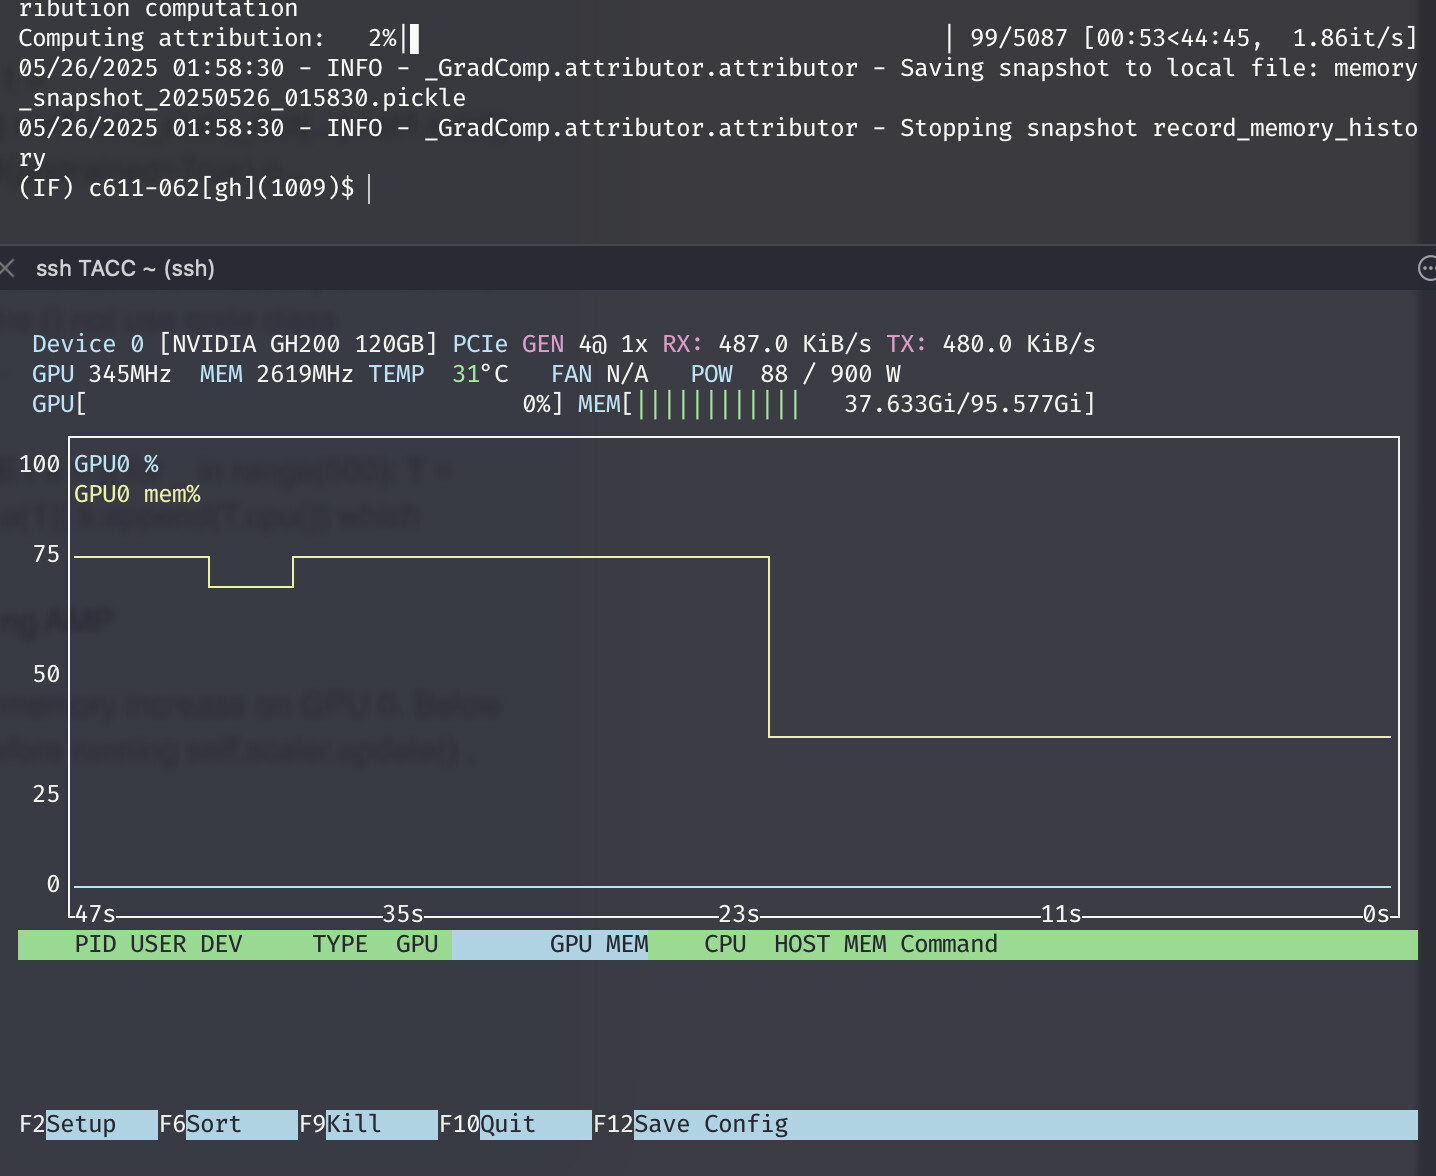
The memory builds up slowly (the left part), and when I kill it, there’s still some memory occupying the GPU memory (the right part). This is what leads me to think there’s some memory leakage. I can’t find related posts regarding this behavior, and I wonder how this can be possible.
I’m sorry that I do not provide a MWE since this only happens in large-scale. I would be happy to provide any further information since I’m stuck for quite a while and can’t pinpoint the root cause of this weird phenomenon.
On the other hand, I have tried to profile the memory usage following https://pytorch.org/blog/understanding-gpu-memory-1/ to debug myself. But I do not see any useful information.
I really have no idea what’s going on, needless to say how to debug it. I really want to understand why this happens and how can I fix this.
For reference, the following is the code snippet I used to profile the code blocks I mentioned, with the
start_record_memory_history(),export_memory_snapshot(), andexport_memory_snapshot()defined as in the profile tutorial:# Start recording memory snapshot history start_record_memory_history() # Create dataloader for IFVP with optimal batch size train_ifvp_dataloader = self.strategy.create_gradient_dataloader( data_type="ifvp", batch_size=2, pin_memory=True ) torch.cuda.empty_cache() # Create the memory snapshot file export_memory_snapshot() start_record_memory_history() logger.info("Starting efficient double-batched attribution computation") # Configure test batching for memory efficiency test_batch_size = min(32, test_sample_count) # Process test samples in chunks logger.debug(f"Using test batch size: {test_batch_size}") iteration = 0 # Single pass through training IFVP data with nested test batching for chunk_tensor, batch_mapping in tqdm(train_ifvp_dataloader, desc="Computing attribution"): # Move train chunk to device chunk_tensor_device = self.strategy.move_to_device(chunk_tensor).to(dtype=all_test_gradients.dtype) # Process test gradients in batches to save memory for test_start in range(0, test_sample_count, test_batch_size): test_end = min(test_start + test_batch_size, test_sample_count) test_batch = all_test_gradients[test_start:test_end] # Move test batch to device test_batch_device = self.strategy.move_to_device(test_batch) # Efficient batched matrix multiplication for this (train_chunk, test_batch) pair # Shape: (chunk_samples, proj_dim) @ (proj_dim, test_batch_samples) -> (chunk_samples, test_batch_samples) chunk_scores = torch.matmul(chunk_tensor_device, test_batch_device.t()) # Map chunk results back to global sample indices for batch_idx, (start_row, end_row) in batch_mapping.items(): if batch_idx not in batch_to_sample_mapping: continue train_start, train_end = batch_to_sample_mapping[batch_idx] batch_scores = chunk_scores[start_row:end_row] IF_score[train_start:train_end, test_start:test_end] = batch_scores.to(IF_score.device) # Clean up test batch from device # del test_batch_device, chunk_scores torch.cuda.empty_cache() # Clean up train chunk from device # del chunk_tensor_device torch.cuda.empty_cache() iteration += 1 if iteration == 100: break # Create the memory snapshot file export_memory_snapshot()