GPU not fully used

Hello all.

Here again, still new to PyTorch so bear with me here.

I’m trying to train a network for the purpose of segmentation of 1 class. Namely humans. I got some pretty good results using resnet+unet as found on this repo; Repo ; The problem is that I’m now trying to add more data and when trying I noticed the gpu isn’t being fully used. I played around with the batch size and also noticed that its being fully used on big batch sizes and not on small ones. So is there another bottleneck I presume? (for small batches?)

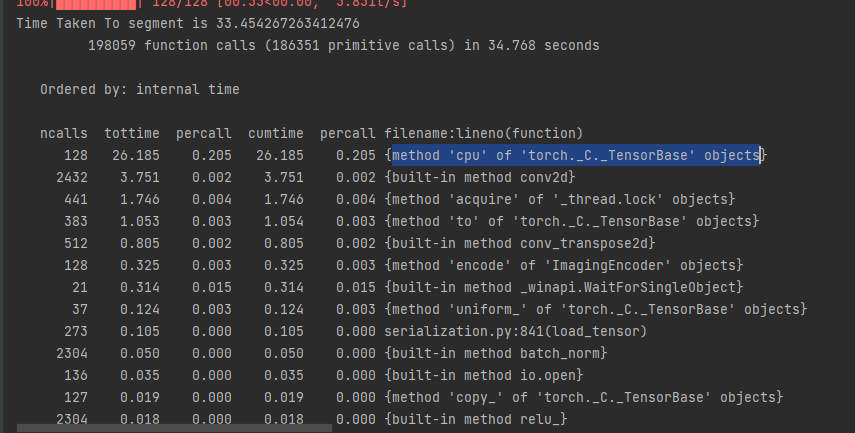
This is the (top)output of profiling on a very small subset, with less than 30% GPU utilization:

Tell me if I’m wrong here, but decode is prolly splitting my .png images in triple channel?

  ncalls  tottime  percall  cumtime  percall filename:lineno(function)
    26202   16.601    0.001   16.601    0.001 {method 'decode' of 'ImagingDecoder' objects}
     1616   11.061    0.007   11.172    0.007 {method 'to' of 'torch._C._TensorBase' objects}
      500    7.693    0.015    7.693    0.015 {method 'run_backward' of 'torch._C._EngineBase' objects}
     2034    7.032    0.003    7.032    0.003 {method 'convert' of 'ImagingCore' objects}
     1620    5.496    0.003    5.496    0.003 {method 'cpu' of 'torch._C._TensorBase' objects}
    17820    3.803    0.000    3.803    0.000 {built-in method conv2d}
    86000    3.200    0.000    3.200    0.000 {method 'mul_' of 'torch._C._TensorBase' objects}
    86000    3.065    0.000    3.065    0.000 {method 'add_' of 'torch._C._TensorBase' objects}
    43000    2.309    0.000    2.309    0.000 {method 'sqrt' of 'torch._C._TensorBase' objects}
    10800    1.537    0.000    1.537    0.000 {built-in method batch_norm}
    43000    1.438    0.000    1.438    0.000 {method 'addcdiv_' of 'torch._C._TensorBase' objects}
     2160    1.432    0.001    1.432    0.001 {method 'resize' of 'ImagingCore' objects}
    43000    1.393    0.000    1.393    0.000 {method 'addcmul_' of 'torch._C._TensorBase' objects}
     2432    1.170    0.000    1.170    0.000 {method '_write_file' of 'torch._C.CudaFloatStorageBase' objects}
    46428    1.072    0.000    1.072    0.000 {method 'zero_' of 'torch._C._TensorBase' objects}
      560    0.750    0.001    0.750    0.001 {method 'copy' of 'ImagingCore' objects}
    10800    0.719    0.000   28.263    0.003 Trainer.py:61(__getitem__)
      500    0.603    0.001   12.074    0.024 adam.py:49(step)
    15660    0.559    0.000    0.559    0.000 {built-in method threshold_}
    97619    0.495    0.000    0.495    0.000 {method 'read' of '_io.BufferedReader' objects}
    10800    0.484    0.000    2.160    0.000 batchnorm.py:58(forward)
     2700    0.337    0.000    0.337    0.000 {built-in method cat}
      540    0.286    0.001    0.286    0.001 {built-in method binary_cross_entropy_with_logits}
     2196    0.245    0.000    0.245    0.000 {built-in method io.open}
     4320    0.220    0.000    4.246    0.001 resnet.py:38(forward)

The code is the following;


'''
Overwriting the pytorch dataset
'''
class QCDataset(Dataset):

    def __init__(self, paths, numberOfItems=1, transform=None):
        self.paths = paths
        self.transform = transform
        ds = qc_ds.Dataset(0, 0, 0, 0)
        (frontImages, frontMasks, sideImages, sideMasks) = ds.get_file_names(paths)
        self.frontImages = frontImages[0:numberOfItems]
        self.frontMasks = frontMasks[0:numberOfItems]
        self.images = [None] * numberOfItems
        self.masks = [None] * numberOfItems
        self.length = numberOfItems

    def __len__(self):
        return self.length

    def __getitem__(self, idx):

        if( self.images[idx] is None and self.masks[idx] is None ):
            image = Image.open(self.frontImages[idx]).convert('RGB')
            mask = Image.open(self.frontMasks[idx]).convert('1')
            image = self.transform(image)
            mask = mask.resize((input_size, input_size))
            mask = torch.tensor(np.asarray(mask, dtype=np.uint8))
            self.images[idx] = image
            self.masks[idx] = mask

        return self.images[idx], self.masks[idx]


def calc_loss(pred, target, metrics, bce_weight=0.5):

    pred = pred.squeeze(1)

    bce = F.binary_cross_entropy_with_logits(pred, target)

    pred = F.sigmoid(pred)
    dice = dice_loss(pred, target)

    loss = bce * bce_weight + dice * (1 - bce_weight)

    metrics['bce'] += bce.data.cpu().numpy() * target.size(0)
    metrics['dice'] += dice.data.cpu().numpy() * target.size(0)
    metrics['loss'] += loss.data.cpu().numpy() * target.size(0)

    return loss

def print_metrics(metrics, epoch_samples, phase):
    outputs = []
    for k in metrics.keys():
        outputs.append("{}: {:4f}".format(k, metrics[k] / epoch_samples))

    print("{}: {}".format(phase, ", ".join(outputs)))

def train_model(model, optimizer, scheduler, num_epochs=25, dataloaders=None):
    best_model_wts = copy.deepcopy(model.state_dict())
    best_loss = 1e10

    for epoch in range(num_epochs):
        print('Epoch {}/{}'.format(epoch, num_epochs - 1))
        print('-' * 10)

        if epoch % 10 is 0:
            printGPUStats()

        since = time.time()

        # Each epoch has a training and validation phase
        for phase in ['train', 'val']:
            if phase == 'train':
                scheduler.step()
                for param_group in optimizer.param_groups:
                    print("LR", param_group['lr'])

                model.train()  # Set model to training mode
            else:
                model.eval()   # Set model to evaluate mode

            metrics = defaultdict(float)
            epoch_samples = 0
            loss = None
            for inputs, labels in dataloaders[phase]:
                inputs = inputs.to(device)
                labels = labels.to(device)

                inputs = inputs.float()
                labels = labels.float()

              #  print(inputs.shape,' ' , labels.shape)

                # zero the parameter gradients
                optimizer.zero_grad()

                # forward
                # track history if only in train
                with torch.set_grad_enabled(phase == 'train'):
                    outputs = model(inputs)

                   # print(outputs.shape)

                    loss = calc_loss(outputs, labels, metrics)

                    # backward + optimize only if in training phase
                    if phase == 'train':
                        loss.backward()
                        optimizer.step()

                # statistics
                epoch_samples += inputs.size(0)


            print_metrics(metrics, epoch_samples, phase)
            epoch_loss = metrics['loss'] / epoch_samples

            # deep copy the model
            if phase == 'val' and epoch_loss < best_loss:
                print("saving best model")
                best_loss = epoch_loss
                best_model_wts = copy.deepcopy(model.state_dict())
                torch.save(model.state_dict(), './result/currentBest.h5')

        time_elapsed = time.time() - since
        print('{:.0f}m {:.0f}s'.format(time_elapsed // 60, time_elapsed % 60))

    print('Best val loss: {:4f}'.format(best_loss))

    # load best model weights
    model.load_state_dict(best_model_wts)
    return model

'''
Setup the model and train it.
'''
def continue_training(model_path, numberOfClasses=1, learningRate=1e-4, input_size=256, stepSize=100, numberOfEpochs=50, outputName='res_2.h5', loaders=None):

    device = torch.device('cuda' if torch.cuda.is_available() else 'cpu')

    #model = UNet.UNet(n_class=numberOfClasses)
    # model = FCN.FCN(n_class=1)
    model = ResNetUNet.ResNetUNet(n_class=numberOfClasses)

    model = model.to(device)
    model.load_state_dict(torch.load(model_path))
    model.cuda()

    # check keras-like model summary using torchsummary
    #summary(model, input_size=(3, input_size, input_size))

    optimizer_ft = optim.Adam(filter(lambda p: p.requires_grad, model.parameters()), lr=learningRate)

    exp_lr_scheduler = lr_scheduler.StepLR(optimizer_ft, step_size=stepSize, gamma=0.1)

    model = train_model(model, optimizer_ft, exp_lr_scheduler, num_epochs=numberOfEpochs, dataloaders=loaders)

    torch.save(model.state_dict(), output_path + outputName)

'''
Setup the model and train it.
'''
def new_training(numberOfClasses=1, learningRate=1e-4, input_size=256, stepSize=100, numberOfEpochs=50, outputName='res.h5', loaders=None):

    device = torch.device('cuda' if torch.cuda.is_available() else 'cpu')

    #model = UNet.UNet(n_class=numberOfClasses)
    #model = FCN.FCN(n_class=1)
    model = ResNetUNet.ResNetUNet(n_class=1)

    model = model.to(device)
    model.cuda()

    # check keras-like model summary using torchsummary
    #summary(model, input_size=(3, input_size, input_size))

    optimizer_ft = optim.Adam(filter(lambda p: p.requires_grad, model.parameters()), lr=learningRate)

    exp_lr_scheduler = lr_scheduler.StepLR(optimizer_ft, step_size=stepSize, gamma=0.1)

    model = train_model(model, optimizer_ft, exp_lr_scheduler, num_epochs=numberOfEpochs, dataloaders=loaders)

    torch.save(model.state_dict(), output_path + outputName)

def printGPUStats():
    print('Using device:', device)
    print()

    # Additional Info when using cuda
    if device.type == 'cuda':
        print(torch.cuda.get_device_name(0))
        print('Memory Usage:')
        print('Allocated:', round(torch.cuda.memory_allocated(0) / 1024 ** 3, 1), 'GB')
        print('Cached:   ', round(torch.cuda.memory_cached(0) / 1024 ** 3, 1), 'GB')


if __name__ == '__main__':

    '''
    Define some transforms
    '''
    trans = transforms.Compose([
        transforms.Resize((input_size,input_size)),
        transforms.ToTensor(),
        transforms.Normalize([0.485, 0.456, 0.406], [0.229, 0.224, 0.225]) # imagenet
    ])

    ds = qc_ds.Dataset(0, 0, 0, 0)
    #public_train_set = QCDataset(ds.getPublicTrainingPaths(), transform=trans, numberOfItems=2984)
    #public_validation_set = QCDataset(ds.getPublicValidationPaths(), transform=trans, numberOfItems=1420)
    #train_qc_set = QCDataset(ds.getPrivateTrainingPaths(), transform=trans, numberOfItems=1065)
    #val_set = QCDataset(ds.getPrivateValidationPaths(), transform=trans, numberOfItems=20)

    public_train_set = QCDataset(ds.getPublicTrainingPaths(), transform=trans, numberOfItems=2500)
    public_validation_set = QCDataset(ds.getPublicValidationPaths(), transform=trans, numberOfItems=200)

    train_qc_set = QCDataset(ds.getPrivateTrainingPaths(), transform=trans, numberOfItems=800)
    val_set = QCDataset(ds.getPrivateValidationPaths(), transform=trans, numberOfItems=20)

    batch_size = 20

    public_dataloaders = {
        'train': DataLoader(public_train_set, batch_size=batch_size, shuffle=True, num_workers=0),
        'val': DataLoader(public_validation_set, batch_size=batch_size, shuffle=True, num_workers=0)
    }

    private_dataloaders = {
        'train': DataLoader(train_qc_set, batch_size=batch_size, shuffle=True, num_workers=0),
        'val': DataLoader(val_set, batch_size=batch_size, shuffle=True, num_workers=0)
    }

    out = 'tunet_model.h5'
    out2 = 'double_trained_model.h5'
    device = torch.device('cuda' if torch.cuda.is_available() else 'cpu')


    pr.enable()
    new_training(numberOfClasses=1, learningRate=1e-4, input_size=256, stepSize=200, numberOfEpochs=500,outputName=out, loaders=public_dataloaders)
    continue_training(output_path+out, numberOfClasses=1, learningRate=1e-4, input_size=256, stepSize=200, numberOfEpochs=500, outputName=out2, loaders=private_dataloaders)
    pr.disable()
    pr.print_stats(sort='time')
2 Likes

It looks like you’ve used some caching mechanism in your Dataset.
Is it working properly after the first epoch?
You could try to set pin_memory=True in your DataLoader and pass non_blocking=True to the tensor.to() call to speed up the transfer.

1 Like

Seems to be working. I have seen very few examples serving data from memory could you enlighten me as to why? Given that my dataset fits into my ram memory. And even AWS GPU server have ludicrous amounts of ram?

With the changes you suggest I get this

(def calc_loss uses .cpu heavily, any suggestions on how to improve this?)

  2350647 function calls (2293645 primitive calls) in 192.886 seconds

   Ordered by: internal time

   ncalls  tottime  percall  cumtime  percall filename:lineno(function)
     1050   91.521    0.087   91.521    0.087 {method 'cpu' of 'torch._C._TensorBase' objects}
    11550   16.191    0.001   16.191    0.001 {built-in method conv2d}
      350   10.167    0.029   10.167    0.029 {built-in method binary_cross_entropy_with_logits}
     1750    9.716    0.006    9.716    0.006 {built-in method cat}
    10150    8.492    0.001    8.492    0.001 {built-in method threshold_}
    39682    6.563    0.000    6.563    0.000 {method 'decode' of 'ImagingDecoder' objects}
      700    6.099    0.009    6.099    0.009 {method 'pin_memory' of 'torch._C._TensorBase' objects}
      345    5.686    0.016    5.686    0.016 {method 'run_backward' of 'torch._C._EngineBase' objects}
      350    3.926    0.011    5.144    0.015 Loss.py:5(dice_loss)
     1750    3.245    0.002    3.245    0.002 {built-in method torch._C._nn.upsample_bilinear2d}
     3135    2.887    0.001    2.887    0.001 {method 'convert' of 'ImagingCore' objects}
      700    2.474    0.004    2.474    0.004 {built-in method stack}
    59340    2.422    0.000    2.422    0.000 {method 'mul_' of 'torch._C._TensorBase' objects}
    59340    2.287    0.000    2.287    0.000 {method 'add_' of 'torch._C._TensorBase' objects}
      350    1.842    0.005  108.726    0.311 Trainer.py:79(calc_loss)
     2800    1.772    0.001    1.772    0.001 {method 'resize' of 'ImagingCore' objects}
      968    1.755    0.002    1.845    0.002 {method 'to' of 'torch._C._TensorBase' objects}
    29670    1.700    0.000    1.700    0.000 {method 'sqrt' of 'torch._C._TensorBase' objects}
     2100    1.149    0.001    1.149    0.001 {method 'sum' of 'torch._C._TensorBase' objects}
     7000    1.102    0.000    1.102    0.000 {built-in method batch_norm}
    29670    1.074    0.000    1.074    0.000 {method 'addcdiv_' of 'torch._C._TensorBase' objects}
    29670    1.041    0.000    1.041    0.000 {method 'addcmul_' of 'torch._C._TensorBase' objects}

For reference without

     2303784 function calls (2249456 primitive calls) in 193.183 seconds

   Ordered by: internal time

   ncalls  tottime  percall  cumtime  percall filename:lineno(function)
      968  108.155    0.112  108.257    0.112 {method 'to' of 'torch._C._TensorBase' objects}
     1050   42.901    0.041   42.901    0.041 {method 'cpu' of 'torch._C._TensorBase' objects}
    39682    6.515    0.000    6.515    0.000 {method 'decode' of 'ImagingDecoder' objects}
      345    5.392    0.016    5.392    0.016 {method 'run_backward' of 'torch._C._EngineBase' objects}
    11550    2.967    0.000    2.967    0.000 {built-in method conv2d}
     3135    2.848    0.001    2.848    0.001 {method 'convert' of 'ImagingCore' objects}
      700    2.494    0.004    2.494    0.004 {built-in method stack}
    59340    2.389    0.000    2.389    0.000 {method 'mul_' of 'torch._C._TensorBase' objects}
    59340    2.281    0.000    2.281    0.000 {method 'add_' of 'torch._C._TensorBase' objects}
     2800    1.753    0.001    1.753    0.001 {method 'resize' of 'ImagingCore' objects}
    29670    1.704    0.000    1.704    0.000 {method 'sqrt' of 'torch._C._TensorBase' objects}
    29670    1.079    0.000    1.079    0.000 {method 'addcdiv_' of 'torch._C._TensorBase' objects}
     7000    1.044    0.000    1.044    0.000 {built-in method batch_norm}
    29670    1.041    0.000    1.041    0.000 {method 'addcmul_' of 'torch._C._TensorBase' objects}

If you set pin_memory=True in your DataLoader the data in your Dataset will be loaded into pinned host memory, which makes the transfer to the device faster. Have a look at NVIDIA’s blog post about this topic.

I’m not that sure that calc_loss really takes that much time on the CPU.
Since you are not synchronizing explicitly and call loss.data.cpu().numpy() this line of code has to wait for the GPU to finish all operations on loss, such that it can be transferred onto the CPU.
I guess the time just shows the waiting time for the GPU.

How did you time your script? Is the first profiling output using pin_memory=True while the second one doesn’t use it?

Correct. The first one uses the changes you suggested and the second one doesn’t.

I’m using the profiler;

import cProfile
pr = cProfile.Profile()
pr.enable() 
continue_training(output_path+out, numberOfClasses=1, learningRate=1e-4, input_size=input_size, stepSize=200, numberOfEpochs=5, outputName=out2, loaders=private_dataloaders)    
pr.disable()    
pr.print_stats(sort='time')

1 Like

Thanks for the info.
Could you additionally use torch.utils.bottleneck to profile your code?

Ok first without the suggested changes

--------------------------------------------------------------------------------
  Environment Summary
--------------------------------------------------------------------------------
PyTorch 1.0.0 compiled w/ CUDA 10.0
Running with Python 3.6 and CUDA 9.0.176

`pip3 list` truncated output:
numpy (1.15.4)
torch (1.0.0)
torch-salad (0.2.1a0)
torchsummary (1.5.1)
torchvision (0.2.1)
--------------------------------------------------------------------------------
  cProfile output
--------------------------------------------------------------------------------
         14039572 function calls (13943858 primitive calls) in 196.499 seconds

   Ordered by: internal time
   List reduced from 7984 to 15 due to restriction <15>

   ncalls  tottime  percall  cumtime  percall filename:lineno(function)
      968  107.041    0.111  107.041    0.111 {method 'to' of 'torch._C._TensorBase' objects}
     1050   42.655    0.041   42.655    0.041 {method 'cpu' of 'torch._C._TensorBase' objects}
    39682    6.548    0.000    6.548    0.000 {method 'decode' of 'ImagingDecoder' objects}
      345    5.424    0.016    5.424    0.016 {method 'run_backward' of 'torch._C._EngineBase' objects}
    11550    2.932    0.000    2.932    0.000 {built-in method conv2d}
     3135    2.866    0.001    2.866    0.001 {method 'convert' of 'ImagingCore' objects}
      700    2.374    0.003    2.374    0.003 {built-in method stack}
    59340    2.366    0.000    2.366    0.000 {method 'mul_' of 'torch._C._TensorBase' objects}
    59340    2.250    0.000    2.250    0.000 {method 'add_' of 'torch._C._TensorBase' objects}
     2800    1.768    0.001    1.768    0.001 {method 'resize' of 'ImagingCore' objects}
    29670    1.683    0.000    1.683    0.000 {method 'sqrt' of 'torch._C._TensorBase' objects}
    35366    1.224    0.000    1.224    0.000 {built-in method nt.stat}
    29670    1.061    0.000    1.061    0.000 {method 'addcdiv_' of 'torch._C._TensorBase' objects}
     1551    1.033    0.001    2.266    0.001 C:\Users\Sklipnoty\AppData\Local\Programs\Python\Python36\lib\inspect.py:714(getmodule)
     7000    1.032    0.000    1.032    0.000 {built-in method batch_norm}


--------------------------------------------------------------------------------
  autograd profiler output (CPU mode)
--------------------------------------------------------------------------------
        top 15 events sorted by cpu_time_total

------  ---------------  ---------------  ---------------  ---------------  ---------------
Name           CPU time        CUDA time            Calls        CPU total       CUDA total
------  ---------------  ---------------  ---------------  ---------------  ---------------
to         380902.828us          0.000us                1     380902.828us          0.000us
to         376077.611us          0.000us                1     376077.611us          0.000us
to         374673.211us          0.000us                1     374673.211us          0.000us
to         372762.354us          0.000us                1     372762.354us          0.000us
to         372180.258us          0.000us                1     372180.258us          0.000us
to         371888.240us          0.000us                1     371888.240us          0.000us
to         371833.937us          0.000us                1     371833.937us          0.000us
to         371642.490us          0.000us                1     371642.490us          0.000us
to         370978.386us          0.000us                1     370978.386us          0.000us
to         370178.802us          0.000us                1     370178.802us          0.000us
to         370138.628us          0.000us                1     370138.628us          0.000us
to         369728.308us          0.000us                1     369728.308us          0.000us
to         369525.225us          0.000us                1     369525.225us          0.000us
to         367767.579us          0.000us                1     367767.579us          0.000us
to         367330.938us          0.000us                1     367330.938us          0.000us

--------------------------------------------------------------------------------
  autograd profiler output (CUDA mode)
--------------------------------------------------------------------------------
        top 15 events sorted by cpu_time_total

        Because the autograd profiler uses the CUDA event API,
        the CUDA time column reports approximately max(cuda_time, cpu_time).
        Please ignore this output if your code does not use CUDA.

------  ---------------  ---------------  ---------------  ---------------  ---------------
Name           CPU time        CUDA time            Calls        CPU total       CUDA total
------  ---------------  ---------------  ---------------  ---------------  ---------------
to         217067.124us       5554.688us                1     217067.124us       5554.688us
to         213935.831us       4132.812us                1     213935.831us       4132.812us
to         213064.211us       4640.625us                1     213064.211us       4640.625us
to         210899.292us       7593.750us                1     210899.292us       7593.750us
to         210715.881us       5867.188us                1     210715.881us       5867.188us
to         210535.517us       4320.312us                1     210535.517us       4320.312us
to         210234.910us       5375.000us                1     210234.910us       5375.000us
to         209686.062us       7722.656us                1     209686.062us       7722.656us
to         209682.460us       5093.750us                1     209682.460us       5093.750us
to         208417.697us       4187.500us                1     208417.697us       4187.500us
to         207810.943us       4703.125us                1     207810.943us       4703.125us
to         207540.813us       5859.375us                1     207540.813us       5859.375us
to         207383.722us       5031.250us                1     207383.722us       5031.250us
to         207044.882us       3968.750us                1     207044.882us       3968.750us
to         205328.794us       4980.469us                1     205328.794us       4980.469us

With the changes

--------------------------------------------------------------------------------
  Environment Summary
--------------------------------------------------------------------------------
PyTorch 1.0.0 compiled w/ CUDA 10.0
Running with Python 3.6 and CUDA 9.0.176

`pip3 list` truncated output:
numpy (1.15.4)
torch (1.0.0)
torch-salad (0.2.1a0)
torchsummary (1.5.1)
torchvision (0.2.1)
--------------------------------------------------------------------------------
  cProfile output
--------------------------------------------------------------------------------
         14086208 function calls (13987821 primitive calls) in 197.021 seconds

   Ordered by: internal time
   List reduced from 7987 to 15 due to restriction <15>

   ncalls  tottime  percall  cumtime  percall filename:lineno(function)
     1050   89.731    0.085   89.731    0.085 {method 'cpu' of 'torch._C._TensorBase' objects}
    11550   15.540    0.001   15.540    0.001 {built-in method conv2d}
      350   10.093    0.029   10.093    0.029 {built-in method binary_cross_entropy_with_logits}
     1750    9.765    0.006    9.765    0.006 {built-in method cat}
    10150    8.467    0.001    8.467    0.001 {built-in method threshold_}
    39682    6.891    0.000    6.891    0.000 {method 'decode' of 'ImagingDecoder' objects}
      700    6.191    0.009    6.191    0.009 {method 'pin_memory' of 'torch._C._TensorBase' objects}
      345    5.894    0.017    5.894    0.017 {method 'run_backward' of 'torch._C._EngineBase' objects}
      350    3.969    0.011    5.149    0.015 C:\Users\Sklipnoty\PycharmProjects\SemanticSegmentation\unet_pytorch\Loss.py:5(dice_loss)
     1750    3.226    0.002    3.226    0.002 {built-in method torch._C._nn.upsample_bilinear2d}
     3135    2.986    0.001    2.986    0.001 {method 'convert' of 'ImagingCore' objects}
    59340    2.496    0.000    2.496    0.000 {method 'mul_' of 'torch._C._TensorBase' objects}
      700    2.383    0.003    2.383    0.003 {built-in method stack}
    59340    2.367    0.000    2.367    0.000 {method 'add_' of 'torch._C._TensorBase' objects}
      968    2.087    0.002    2.087    0.002 {method 'to' of 'torch._C._TensorBase' objects}


--------------------------------------------------------------------------------
  autograd profiler output (CPU mode)
--------------------------------------------------------------------------------
        top 15 events sorted by cpu_time_total

------  ---------------  ---------------  ---------------  ---------------  ---------------
Name           CPU time        CUDA time            Calls        CPU total       CUDA total
------  ---------------  ---------------  ---------------  ---------------  ---------------
to         298077.616us          0.000us                1     298077.616us          0.000us
to         292503.516us          0.000us                1     292503.516us          0.000us
to         292324.815us          0.000us                1     292324.815us          0.000us
to         291869.888us          0.000us                1     291869.888us          0.000us
to         286080.238us          0.000us                1     286080.238us          0.000us
to         285979.112us          0.000us                1     285979.112us          0.000us
to         284833.483us          0.000us                1     284833.483us          0.000us
to         283133.188us          0.000us                1     283133.188us          0.000us
to         282986.902us          0.000us                1     282986.902us          0.000us
to         281562.831us          0.000us                1     281562.831us          0.000us
to         281104.580us          0.000us                1     281104.580us          0.000us
to         280239.332us          0.000us                1     280239.332us          0.000us
to         280235.454us          0.000us                1     280235.454us          0.000us
to         280027.385us          0.000us                1     280027.385us          0.000us
to         279814.328us          0.000us                1     279814.328us          0.000us

--------------------------------------------------------------------------------
  autograd profiler output (CUDA mode)
--------------------------------------------------------------------------------
        top 15 events sorted by cpu_time_total

        Because the autograd profiler uses the CUDA event API,
        the CUDA time column reports approximately max(cuda_time, cpu_time).
        Please ignore this output if your code does not use CUDA.

------  ---------------  ---------------  ---------------  ---------------  ---------------
Name           CPU time        CUDA time            Calls        CPU total       CUDA total
------  ---------------  ---------------  ---------------  ---------------  ---------------
to         168797.231us        187.500us                1     168797.231us        187.500us
to         165418.527us        205.811us                1     165418.527us        205.811us
to         163756.465us        187.500us                1     163756.465us        187.500us
to         160709.951us        171.875us                1     160709.951us        171.875us
to         160394.107us        382.812us                1     160394.107us        382.812us
to         160272.480us        187.500us                1     160272.480us        187.500us
to         160098.488us        203.125us                1     160098.488us        203.125us
to         160089.345us        179.688us                1     160089.345us        179.688us
to         160002.627us        269.531us                1     160002.627us        269.531us
to         159931.977us        218.750us                1     159931.977us        218.750us
to         159812.289us        312.500us                1     159812.289us        312.500us
to         159762.973us        187.500us                1     159762.973us        187.500us
to         159516.392us        234.375us                1     159516.392us        234.375us
to         159412.496us        429.688us                1     159412.496us        429.688us
to         159323.007us        351.562us                1     159323.007us        351.562us

Thanks for the profiling!
While I’m trying to understand it properly, could you tell me how large your dataset is (all samples in total as MB)?
I assume you are using a ResNet-like architecture?

So I am using resnet + unet as found here https://github.com/usuyama/pytorch-unet/blob/master/pytorch_resnet18_unet.ipynb

My total dataset contains around 5000-6000 images being around 14 gb at original resolution, but I rescale them at runtime.

Thanks for the information!
I was just wondering if pre-loading the whole dataset onto the GPU might help, but it seems to be too large.

Did the caching speed up anything in the second and following epochs or did you see approx. the same GPU utilization?
If your current caching didn’t help, could you try to remove it and set the number of workers higher to see if you can get any performance advantages?

I added new data augmentation, which meant caching wasn’t an option anymore. Seems increasing the number of workers to around 10 and having the batchsize at around 20, did show a noticeable yield in GPU usage. However it’s still not 100%, but from the windows graph data input is now the bottleneck … Thx for your help man.


in my program i used profiler for pytorch
{method ‘cpu’ of ‘torch._C._TensorBase’ objects} takes 25secs how to reduce this time