JamesDickens
August 21, 2021, 3:25am
1
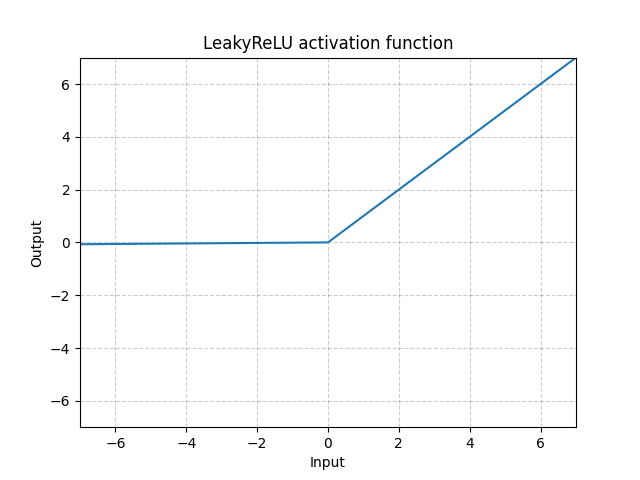
The graph used in the docs available herehttps://pytorch.org/docs/stable/generated/torch.nn.LeakyReLU.html
is the graph of the regular ReLU function. The slope of the graph for x<0 should be non-zero. Is there somewhere to report this so it can be fixed?
I don’t think the plot shows the plain ReLU, but a LeakyReLU using the default negative_slope value of 1e-2.
To reproduce the figure, run:
act = torch.nn.LeakyReLU()
x = torch.arange(-7, 7, 0.01)
out = act(x)

f = plt.figure()
plt.xlim([-7, 7])
plt.ylim([-7, 7])
plt.grid()
plt.plot(x, out)
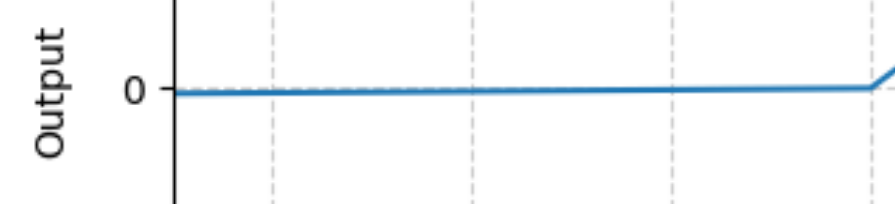
which will create:
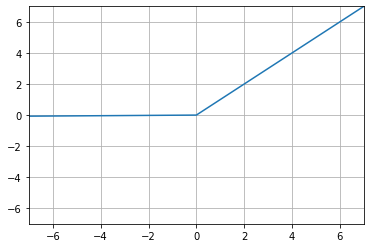
To better see the slope, change the default value:
act = torch.nn.LeakyReLU(negative_slope=0.5)
x = torch.arange(-7, 7, 0.01)
out = act(x)

f = plt.figure()
plt.xlim([-7, 7])
plt.ylim([-7, 7])
plt.grid()
plt.plot(x, out)
1 Like
JamesDickens
August 21, 2021, 4:20am
3
Wow ok my mistake! I didn’t look carefully enough, given the small slope.
1 Like