Does PyTorch have any tool,something like TensorBoard in TensorFlow,to do graph visualization to help users understand and debug network?
Not that I am aware of. However, due to its dynamic nature, it is much easier to debug a network in pytorch than tensorflow.
As one commenter on Reddit opines:
“Debugging is easier because a specific line in your specific code (not something deep under your sess.run() that worked with a large/generated Graph object) fails. Your stack traces don’t fill up three screens and make you play the “spot the actual error!” scrolling game.”
I’ve found it fairly simple to just instrument the code as needed when things don’t go as planned.
look at this post Graph visualization
got it.thank you:+1:
Try VisualDL: https://github.com/PaddlePaddle/VisualDL
VisualDL could produce graph with the ONNX file.
Hi @zsp1197, have you managed to plot the graph in VidualDL? I’m trying to do that for a very simple network, following this example.
What I understand is that I need to export my model in a onnx file, as follows:
import torch.onnx
dummy_input = Variable(torch.randn(4, 3, 32, 32))
torch.onnx.export(net, dummy_input, "model.onnx")
Then, VisualDL’s documentation suggests this. However, in such a case I don’t what logdir to use.
Netron can open ONNX files and supports reading basic sequential pth files.
Also check out this thread: Print Autograd Graph.
I have used Netron to visualize ONNX graphs. If you can export your model to ONNX successfully I would recommend giving it a try.
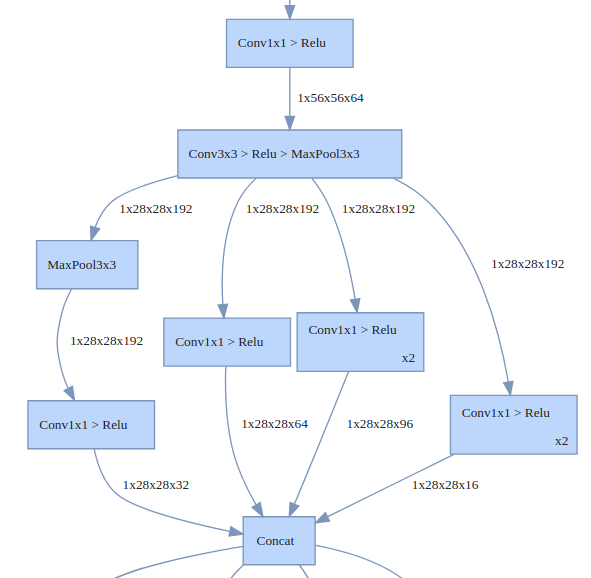
Check out HiddenLayer. I wrote this tool to visualize network graphs, and more specifically to visualize them in a way that is easier to understand. It merges related nodes together (e.g. Conv/Relu/MaxPool) and folds repeating blocks into one box and adds a x3 to imply that the block repeats 3 times rather than drawing it three times. This helps when you try to draw big networks, such as ResNet and Inception.
Great visualization tool! I just tried to visualize my slightly more complex models, and it works seamlessly.
I’ve started a new project for experiment documentation (Spyrkle).
It should be able to generate an interactive graph in an HTML page that you can style using CSS.
@tariqdaouda great work i have few queries like can we use this for custom pytorch object detection architecture ??
Maybe you can try TensorBoardX.
It is TensorBoard for PyTorch.
from tensorboardX import SummaryWriter
writer = SummaryWriter(path)
writer.add_scalars(path,  {'Data1' :value1, 'Data2' :value2}, index)
writer.close()
@abhilash_pinky Should be possible, writing custom crawlers inheriting from pyTorchCrawlergives you a lot a possibilities.
It would be great if PyTorch have built in function for graph visualization.
Thank u so much…it helped me to visualize my ABCDs of resnet to understand it better.
@waleeka Will this tool support Autoencoders and Deep AutoEncoders?