https://drive.google.com/file/d/1yxwD13XgdMvpwbva66J-CSm6YrVO2Q0i/view?usp=sharing
Could you explain the issue a bit more, which approaches you’ve tried, and where you are stuck?
For a general example on plotting the ROC, please refer to e.g. this example.
1 Like
hi here my code.
could yo please draw the roc curve for the code in pytorch.
def train(epochs):
best_model_wts = copy.deepcopy(model.state_dict())

b_acc = 0.0

t_loss = []

t_acc = []

avg_t_loss=[]

avg_t_acc=[]

v_loss = []

v_acc=[]

avg_v_loss = []

avg_v_acc = []

ep = []

print('Starting training..')

for e in range(0, epochs):

    ep.append(e+1)

    print('='*20)

    print(f'Starting epoch {e + 1}/{epochs}')

    print('='*20)

    train_loss = 0.

    val_loss = 0.

    train_accuracy = 0

    total_train = 0

    correct_train = 0

    model.train() # set model to training phase

    for train_step, (images, labels) in enumerate(dl_train):

        optimizer.zero_grad()

        outputs = model(images)

        _, pred = torch.max(outputs, 1)

        loss = loss_fn(outputs, labels)

        loss.backward()

        optimizer.step()

        train_loss += loss.item()

        train_loss /= (train_step + 1)

        _, predicted = torch.max(outputs, 1)

        total_train += labels.nelement()

        correct_train += sum((predicted == labels).numpy())

        train_accuracy = correct_train / total_train

        t_loss.append(train_loss)

        t_acc.append(train_accuracy)


        if train_step % 20 == 0:

            print('Evaluating at step', train_step)

            print(f'Training Loss: {train_loss:.4f}, Training Accuracy: {train_accuracy:.4f}')

            accuracy = 0.

            model.eval() # set model to eval phase

            for val_step, (images, labels) in enumerate(dl_test):

                outputs = model(images)

                loss = loss_fn(outputs, labels)

                val_loss += loss.item()

                _, preds = torch.max(outputs, 1)

                accuracy += sum((preds == labels).numpy())

            val_loss /= (val_step + 1)

            accuracy = accuracy/len(test_dataset)

            print(f'Validation Loss: {val_loss:.4f}, Validation Accuracy: {accuracy:.4f}')

            v_loss.append(val_loss)

            v_acc.append(accuracy)

            show_preds()

            model.train()

            if accuracy > b_acc:

              b_acc = accuracy


    avg_t_loss.append(sum(t_loss)/len(t_loss))

    avg_v_loss.append(sum(v_loss)/len(v_loss))

    avg_t_acc.append(sum(t_acc)/len(t_acc))

    avg_v_acc.append(sum(v_acc)/len(v_acc))


best_model_wts = copy.deepcopy(model.state_dict())

print('Best validation Accuracy: {:4f}'.format(b_acc))

print('Training complete..')


plt.plot(ep, avg_t_loss, 'g', label='Training loss')

plt.plot(ep, avg_v_loss, 'b', label='validation loss')

plt.title('Training and Validation loss for each epoch')

plt.xlabel('Epochs')

plt.ylabel('Loss')

plt.legend()

#plt.savefig('/gdrive/My Drive/Research_Documents_completed/MobileNet/mobilenet_loss.png')

plt.show()

plt.plot(ep, avg_t_acc, 'g', label='Training accuracy')

plt.plot(ep, avg_v_acc, 'b', label='validation accuracy')

plt.title('Training and Validation Accuracy for each epoch')

plt.xlabel('Epochs')

plt.ylabel('Accuracy')

plt.legend()

#plt.savefig('/gdrive/My Drive/Research_Documents_completed/MobileNet/mobilenet_accuarcy.png')

plt.show()

#torch.save(model.state_dict(),'/gdrive/My Drive/Research_Documents_completed/MobileNet/mobilenet.pt')
#confsuion matrix
nb_classes = 2
device = torch.device(“cuda:0” if torch.cuda.is_available() else “cpu”)
confusion_matrix = torch.zeros(nb_classes, nb_classes)
with torch.no_grad():
for i, (inputs, classes) in enumerate(dl_test):

    inputs = inputs.to(device)

    classes = classes.to(device)

    outputs = model(inputs)

    _, preds = torch.max(outputs, 1)

    for t, p in zip(classes.view(-1), preds.view(-1)):

            confusion_matrix[t.long(), p.long()] += 1
print(confusion_matrix)
tensor([[1407., 10.],
[ 17., 1327.]])
I’m unsure where you are stuck, but the link gives the code you could probably directly use:
# Compute ROC curve and ROC area for each class
fpr = dict()
tpr = dict()
roc_auc = dict()
for i in range(n_classes):
fpr[i], tpr[i], _ = roc_curve(y_test[:, i], y_score[:, i])
roc_auc[i] = auc(fpr[i], tpr[i])
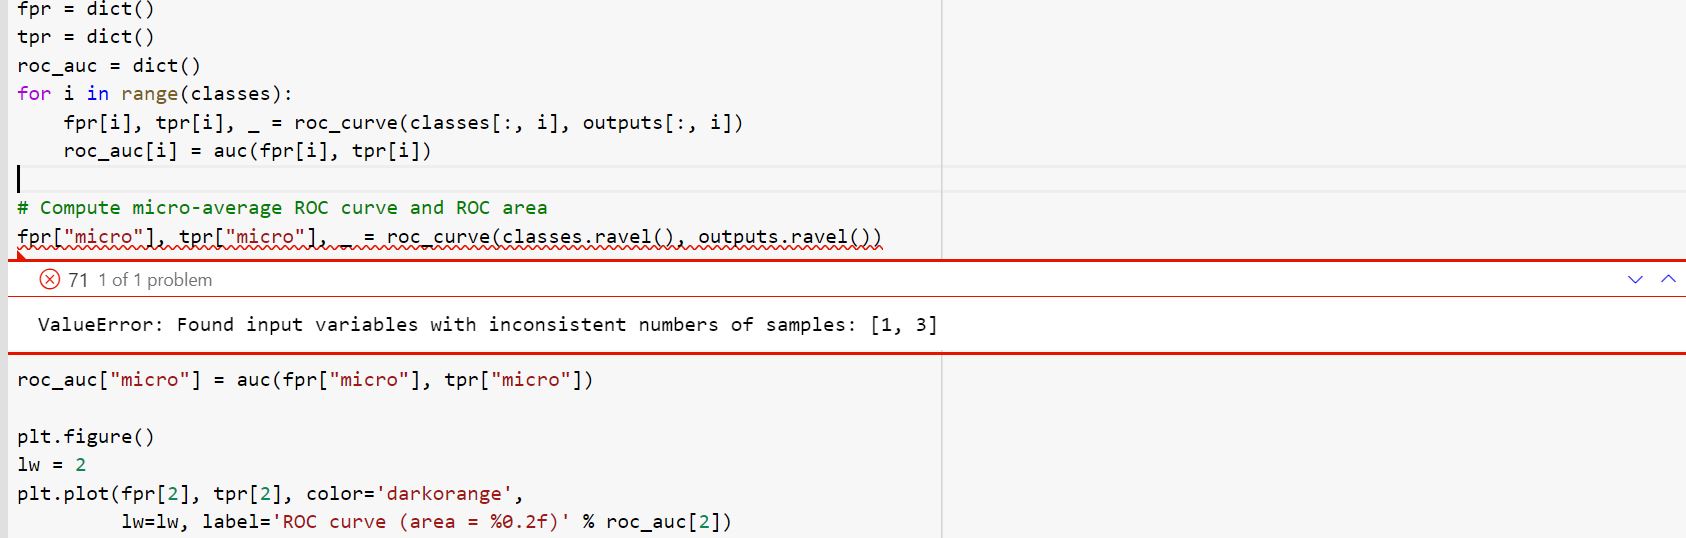
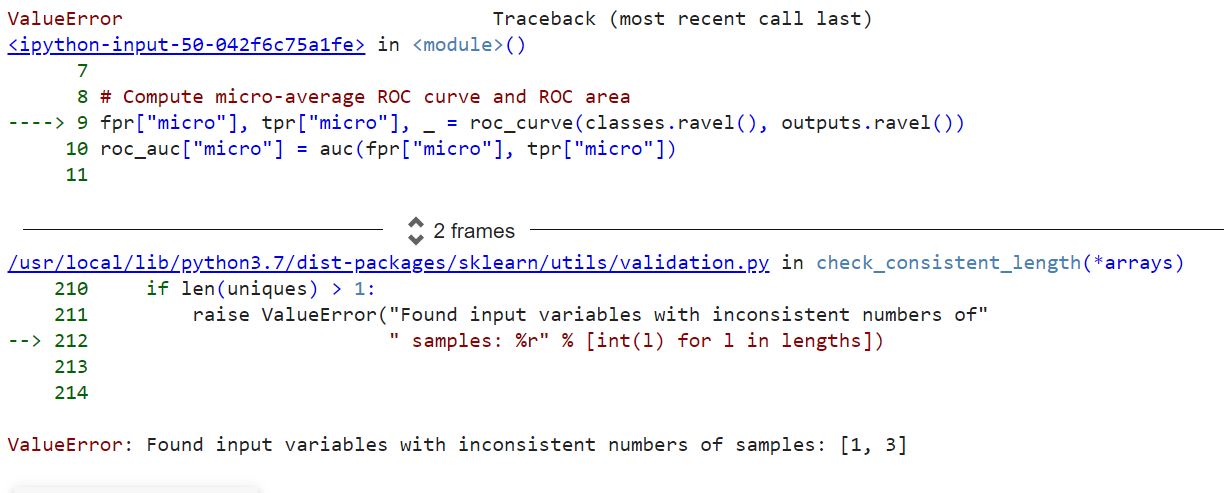
# Compute micro-average ROC curve and ROC area
fpr["micro"], tpr["micro"], _ = roc_curve(y_test.ravel(), y_score.ravel())
roc_auc["micro"] = auc(fpr["micro"], tpr["micro"])
plt.figure()
lw = 2
plt.plot(fpr[2], tpr[2], color='darkorange',
lw=lw, label='ROC curve (area = %0.2f)' % roc_auc[2])
plt.plot([0, 1], [0, 1], color='navy', lw=lw, linestyle='--')
plt.xlim([0.0, 1.0])
plt.ylim([0.0, 1.05])
plt.xlabel('False Positive Rate')
plt.ylabel('True Positive Rate')
plt.title('Receiver operating characteristic example')
plt.legend(loc="lower right")
plt.show()
This will plot the ROC for a specific class and you could of course create multiple figures (or multiple curves in the same plot).
Based on your code you would probably have to replace y_score with outpus and y_test with classes, but since your code is not executable I cannot verify it.
1 Like
hi ptrblck
Actually I am doing a Project of my last year about covid detection from chest x-rays am struggling to plot sensitivity, specificity, and Roc curves if you have any code related to this then please give me the code.
check the link here my code.
https://drive.google.com/file/d/1k8DW4mmqmk-w1Q9jUSGlXLpN73dgvjUh/view?usp=sharing
Error I countered
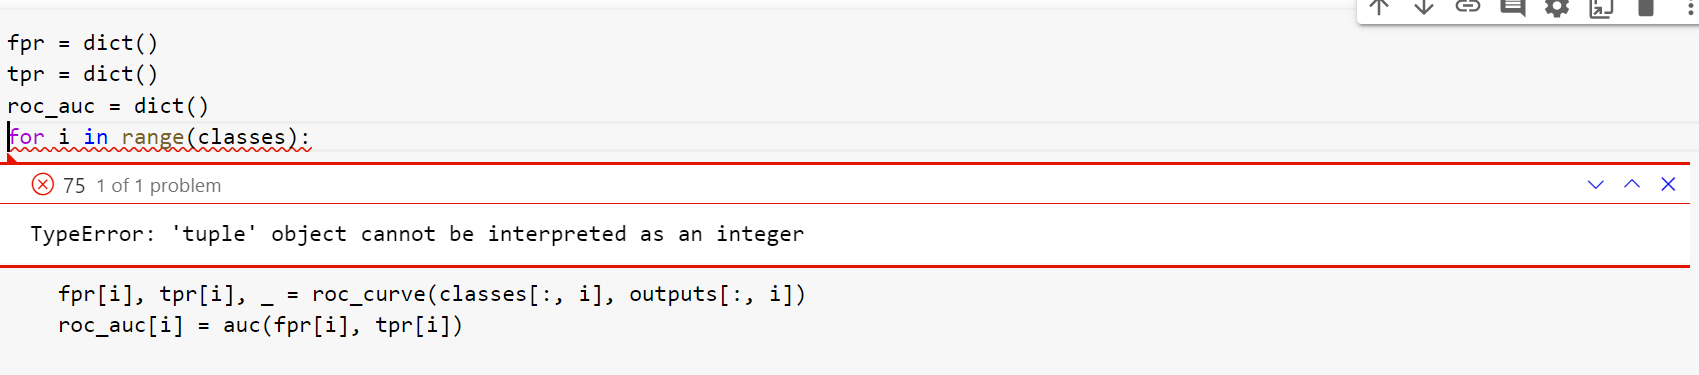
// for i in range(classes):
TypeError Traceback (most recent call last)
in ()
14 tpr = dict()
15 roc_auc = dict()
—> 16 for i in range(classes):
17 fpr[i], tpr[i], _ = roc_curve(classes[:, i], outputs[:, i])
18 roc_auc[i] = auc(fpr[i], tpr[i])
TypeError: ‘tuple’ object cannot be interpreted as an integer
Could you check the types as well as shapes of all objects and post an executable code snippet which would reproduce the issue, please?
1 Like
Import the required modules
import datetime
import pandas as pd
import numpy as np
import matplotlib
import matplotlib.pyplot as plt
%matplotlib inline
matplotlib.rcParams[‘font.size’] = 8
from skimage import img_as_float
from skimage import exposure
import plotly.graph_objects as go
import os
import glob
import random
from skimage import io # To preprocess the images
from distutils.file_util import copy_file
import seaborn as sns
import cv2
import keras
from keras.models import load_model
from keras import backend as K
import tensorflow as tf
from skimage.transform import rescale
from keras_preprocessing.image import ImageDataGenerator
import warnings
warnings.simplefilter(‘ignore’)
%matplotlib inline
import glob
import os
import shutil
import copy
import random
import torch
import torch.nn as nn
import torchvision
import torch.optim as optim
from torch.optim import lr_scheduler
import numpy as np
import seaborn as sns
import time
from sklearn.metrics import confusion_matrix
from PIL import Image
import matplotlib.pyplot as plt
torch.manual_seed(0)
print(‘Using PyTorch version’, torch.version)
if torch.cuda.is_available():
device = torch.device(“cuda:0”)
print(“GPU”)
else:
device = torch.device(“cpu”)
print(“CPU”)
! pip install -q kaggle
from google.colab import files
files.upload()
! mkdir ~/.kaggle
! cp kaggle.json ~/.kaggle/
! chmod 600 ~/.kaggle/kaggle.json
! kaggle datasets download -d mohanrb/mydataset
! mkdir ~/.dataset
!unzip “/content/mydataset.zip” -d “/content/dataset”
class_names = [‘Non-Covid’, ‘Covid’]
root_dir = ‘/content/dataset/MYDATASET’
source_dirs = ['Normal ', ‘COVID’]
DATASET_PATH = ‘/content/dataset/MYDATASET’
There are two classes of images that we will deal with
cls = [‘Normal’, ‘COVID’]
class ChestXRayDataset(torch.utils.data.Dataset):
def init(self, image_dirs, transform):
def get_images(class_name):
images = [x for x in os.listdir(image_dirs[class_name]) if x.lower().endswith(‘png’) or x.lower().endswith(‘jpg’)]
print(f’Found {len(images)} {class_name} examples’)
return images
self.images = {}
self.class_names = [‘Non-Covid’, ‘Covid’]
for class_name in self.class_names:
self.images[class_name] = get_images(class_name)
self.image_dirs = image_dirs
self.transform = transform
def len(self):
return sum([len(self.images[class_name]) for class_name in self.class_names])
def __getitem__(self, index):
class_name = random.choice(self.class_names)
index = index % len(self.images[class_name])
image_name = self.images[class_name][index]
image_path = os.path.join(self.image_dirs[class_name], image_name)
image = Image.open(image_path).convert(‘RGB’)
return self.transform(image), self.class_names.index(class_name)
train_transform = torchvision.transforms.Compose([
torchvision.transforms.Resize(size=(224, 224)),
torchvision.transforms.RandomHorizontalFlip(),
torchvision.transforms.ToTensor(),
torchvision.transforms.Normalize(mean=[0.485, 0.456, 0.406], std=[0.229, 0.224, 0.225])
])
test_transform = torchvision.transforms.Compose([
torchvision.transforms.Resize(size=(224, 224)),
torchvision.transforms.ToTensor(),
torchvision.transforms.Normalize([0.485, 0.456, 0.406], [0.229, 0.224, 0.225])
])
Create new folders for image training
main folder
!mkdir ./Data/
Train data folders
!mkdir ./Data/Train/
!mkdir ./Data/Train/Covid/
!mkdir ./Data/Train/Normal/
Test data folders
!mkdir ./Data/Test/
!mkdir ./Data/Test/Covid/
!mkdir ./Data/Test/Normal/
Paths to covid images folders
pathCovidTrain = ‘./Data/Train/Covid/’
pathCovidTest = ‘./Data/Test/Covid/’
Paths to normal images folders
pathNormalTrain = ‘./Data/Train/Normal/’
pathNormalTest = ‘./Data/Test/Normal/’
Create the list of paths to the images
Lists for access paths
listCovidPaths =
listNormalPaths =
Get covid images files paths
for root, directories, files in os.walk(covid_path[:-2]):
for name in files:

    listCovidPaths.append(os.path.join(root, name))
Get normal images files paths
for root, directories, files in os.walk(normal_path[:-2]):
for name in files:

    listNormalPaths.append(os.path.join(root, name))

    # Shuffle lists for random train / test
random.shuffle(listCovidPaths)
random.shuffle(listNormalPaths)
len_covid = len(os.listdir(covid_path[:-2]))
len_normal = len(os.listdir(normal_path[:-2]))
covid_80 = round(len(os.listdir(covid_path[:-2])) * 0.8) # 80% of the COVID data
normal_80 = round(len(os.listdir(normal_path[:-2])) * 0.8) # 80% of the Normal data
Move normal images files to new folders
for i in range(len_normal):
if i < normal_80:

    copy_file(listNormalPaths[i], pathNormalTrain)

else :

     copy_file(listNormalPaths[i], pathNormalTest)
Move covid images files to new folders
for i in range(len_covid):
if i < covid_80:

    copy_file(listCovidPaths[i], pathCovidTrain)

else :

    copy_file(listCovidPaths[i], pathCovidTest)
train_dirs = {
'Non-Covid': '/content/Data/Train/Normal',

'Covid': '/content/Data/Train/Covid'
}
train_dataset = ChestXRayDataset(train_dirs, train_transform)
test_dirs = {
'Non-Covid': '/content/Data/Test/Normal',

'Covid': '/content/Data/Test/Covid'
}
test_dataset = ChestXRayDataset(test_dirs, test_transform)
batch_size = 25
dl_train = torch.utils.data.DataLoader(train_dataset, batch_size=batch_size, shuffle=True)
dl_test = torch.utils.data.DataLoader(test_dataset, batch_size=batch_size, shuffle=True)
print(dl_train)
print(‘Number of training batches’, len(dl_train))
print(‘Number of test batches’, len(dl_test))
class_names = train_dataset.class_names
def show_images(images, labels, preds):
plt.figure(figsize=(30, 20))

for i, image in enumerate(images):

    plt.subplot(1, 25, i + 1, xticks=[], yticks=[])

    image = image.numpy().transpose((1, 2, 0))

    mean = np.array([0.485, 0.456, 0.406])

    std = np.array([0.229, 0.224, 0.225])

    image = image * std + mean

    image = np.clip(image, 0., 1.)

    plt.imshow(image)

    col = 'green'

    if preds[i] != labels[i]:

        col = 'red'


    plt.xlabel(f'{class_names[int(labels[i].numpy())]}')

    plt.ylabel(f'{class_names[int(preds[i].numpy())]}', color=col)

plt.tight_layout()

plt.show()
model = torchvision.models.mobilenet_v2(pretrained=True)
print(model)
model.classifier[1] = torch.nn.Linear(in_features=1280, out_features=2, bias=True)
loss_fn = torch.nn.CrossEntropyLoss()
optimizer = torch.optim.Adam(model.parameters(), lr=3e-5)
def show_preds():
model.eval()

images, labels = next(iter(dl_test))

outputs = model(images)

_, preds = torch.max(outputs, 1)

show_images(images, labels, preds)
def train(epochs):
best_model_wts = copy.deepcopy(model.state_dict())

b_acc = 0.0

t_loss = []

t_acc = []

avg_t_loss=[]

avg_t_acc=[]

v_loss = []

v_acc=[]

avg_v_loss = []

avg_v_acc = []

ep = []

print('Starting training..')

for e in range(0, epochs):

    ep.append(e+1)

    print('='*20)

    print(f'Starting epoch {e + 1}/{epochs}')

    print('='*20)

    train_loss = 0.

    val_loss = 0.

    train_accuracy = 0

    total_train = 0

    correct_train = 0

    model.train() # set model to training phase

    for train_step, (images, labels) in enumerate(dl_train):

        optimizer.zero_grad()

        outputs = model(images)

        _, pred = torch.max(outputs, 1)

        loss = loss_fn(outputs, labels)

        loss.backward()

        optimizer.step()

        train_loss += loss.item()

        train_loss /= (train_step + 1)

        _, predicted = torch.max(outputs, 1)

        total_train += labels.nelement()

        correct_train += sum((predicted == labels).numpy())

        train_accuracy = correct_train / total_train

        t_loss.append(train_loss)

        t_acc.append(train_accuracy)


        if train_step % 20 == 0:

            print('Evaluating at step', train_step)

            print(f'Training Loss: {train_loss:.4f}, Training Accuracy: {train_accuracy:.4f}')

            accuracy = 0.

            model.eval() # set model to eval phase

            for val_step, (images, labels) in enumerate(dl_test):

                outputs = model(images)

                loss = loss_fn(outputs, labels)

                val_loss += loss.item()

                _, preds = torch.max(outputs, 1)

                accuracy += sum((preds == labels).numpy())

            val_loss /= (val_step + 1)

            accuracy = accuracy/len(test_dataset)

            print(f'Validation Loss: {val_loss:.4f}, Validation Accuracy: {accuracy:.4f}')

            v_loss.append(val_loss)

            v_acc.append(accuracy)

            show_preds()

            model.train()

            if accuracy > b_acc:

              b_acc = accuracy


    avg_t_loss.append(sum(t_loss)/len(t_loss))

    avg_v_loss.append(sum(v_loss)/len(v_loss))

    avg_t_acc.append(sum(t_acc)/len(t_acc))

    avg_v_acc.append(sum(v_acc)/len(v_acc))


best_model_wts = copy.deepcopy(model.state_dict())

print('Best validation Accuracy: {:4f}'.format(b_acc))

print('Training complete..')


plt.plot(ep, avg_t_loss, 'g', label='Training loss')

plt.plot(ep, avg_v_loss, 'b', label='validation loss')

plt.title('Training and Validation loss for each epoch')

plt.xlabel('Epochs')

plt.ylabel('Loss')

plt.legend()

#plt.savefig('/gdrive/My Drive/Research_Documents_completed/MobileNet/mobilenet_loss.png')

plt.show()

plt.plot(ep, avg_t_acc, 'g', label='Training accuracy')

plt.plot(ep, avg_v_acc, 'b', label='validation accuracy')

plt.title('Training and Validation Accuracy for each epoch')

plt.xlabel('Epochs')

plt.ylabel('Accuracy')

plt.legend()

#plt.savefig('/gdrive/My Drive/Research_Documents_completed/MobileNet/mobilenet_accuarcy.png')

plt.show()

#torch.save(model.state_dict(),'/gdrive/My Drive/Research_Documents_completed/MobileNet/mobilenet.pt')
%%time
train(epochs=3)
nb_classes = 2
device = torch.device(“cuda:0” if torch.cuda.is_available() else “cpu”)
confusion_matrix = torch.zeros(nb_classes, nb_classes)
with torch.no_grad():
for i, (inputs, classes) in enumerate(dl_test):

    inputs = inputs.to(device)

    classes = classes.to(device)

    outputs = model(inputs)

    _, preds = torch.max(outputs, 1)

    for t, p in zip(classes.view(-1), preds.view(-1)):

            confusion_matrix[t.long(), p.long()] += 1
print(confusion_matrix)
import itertools
import numpy as np
import matplotlib.pyplot as plt
def plot_confusion_matrix(cm, classes, normalize=False, title=‘Confusion matrix’, cmap=plt.cm.Blues):
if normalize:

    cm = cm.astype('float') / cm.sum(axis=1)[:, np.newaxis]

    print("Normalized confusion matrix")

else:

    print('Confusion matrix, without normalization')

print(cm)

plt.imshow(cm, interpolation='nearest', cmap=cmap)

plt.title(title)

plt.colorbar()

tick_marks = np.arange(len(classes))

plt.xticks(tick_marks, classes, rotation=45)

plt.yticks(tick_marks, classes)

fmt = '.2f'

thresh = cm.max() / 2.

for i, j in itertools.product(range(cm.shape[0]), range(cm.shape[1])):

    plt.text(float(j),float(i), format(cm[i, j], fmt), horizontalalignment="center", color="white" if cm[i, j] > thresh else "black")

plt.tight_layout()

plt.ylabel('True label')

plt.xlabel('Predicted label')
plot_confusion_matrix(confusion_matrix,class_names)
import tensorflow as tf
FP = (confusion_matrix.sum(axis=0) - np.diag(confusion_matrix)).numpy()
FN = (confusion_matrix.sum(axis=1) - np.diag(confusion_matrix)).numpy()
TP = np.diag(confusion_matrix)
TN = (confusion_matrix.sum() - (FP + FN + TP)).numpy()
FP = FP.astype(float)
FN = FN.astype(float)
TP = TP.astype(float)
TN = TN.astype(float)
Sensitivity, hit rate, recall, or true positive rate
TPR = TP/(TP+FN)
Specificity or true negative rate
TNR = TN/(TN+FP)
Precision or positive predictive value
PPV = TP/(TP+FP)
Negative predictive value
NPV = TN/(TN+FN)
Fall out or false positive rate
FPR = FP/(FP+TN)
False negative rate
FNR = FN/(TP+FN)
False discovery rate
FDR = FP/(TP+FP)
Overall accuracy for each class
ACC = (TP+TN)/(TP+FP+FN+TN)
#its my code
#so far I completed and I got confusion matrix but further plotting sensitivity, specificity, and ROC curves iam troubling please give the solution.
Your code is unfortunately not executable and also doesn’t show a minimal snippet yielding the error. You can also format code by wrapping it into three backticks ``` 
Based on the screenshot, range(classes) raises the error, since classes is a tuple while an int is expected.
1 Like