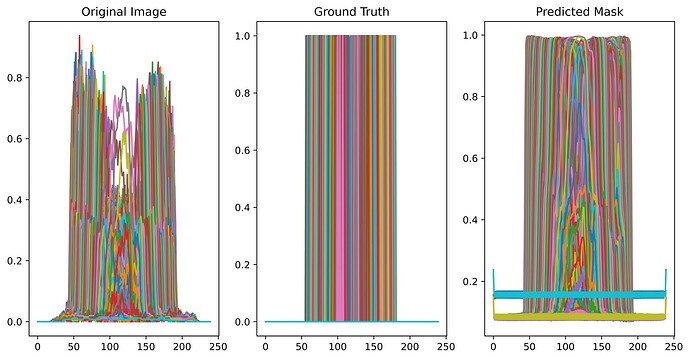
Hi everyone. I am trying to plot the original image, mask and predicted mask from the UNet model, however, I am getting weird images as my output. This is a method I used before, which worked perfectly but for some weird reason, it is not working anymore…
As shown in the image above, I am not getting an image at all…
Here is how I am calling the dataset:
import os
import numpy as np
import torch
from torch.utils.data import Dataset
from PIL import Image
from torchvision import transforms
class GetData(Dataset):
def init(self, img_path, mask_path, transform=None):
self.img_path = img_path
self.mask_path = mask_path
self.transform = transform
def __len__(self):
    return len(self.img_path)

def __getitem__(self, idx):
    image = np.array(Image.open(self.img_path[idx]).convert('RGB'),
                     dtype=np.float32)
    mask = np.array(Image.open(self.mask_path[idx]).convert('L'),
                     dtype=np.float32)
    mask = ((mask/np.max([mask.max(), 1e-8])) > 0.5).astype(np.float32)


    if self.transform is not None:
        augmentations = self.transform(image=image, mask=mask)
        image = augmentations['image']
        mask = augmentations['mask']


    return image, mask
And here is the testing loop which prints to the images:
def testinge_loop (model, loader, device=torch.device(‘cuda’)):
dice = []
model.eval()
with torch.no_grad():
    for x, y in loader:

        # split data to image and mask
        image = x
        mask = y

        image = image.to(device)
        mask = mask.to(device)

        test_outputs = model(image)
        test_outputs = torch.sigmoid(test_outputs)

        dice_metric = dice_metrics(test_outputs, mask)
        dice.append(dice_metric.cpu().numpy())


        plt.figure(figsize=(12,6), dpi=1200)
        plt.subplot(1,3,1)
        plt.title('Original Image')
        plt.plot(image[0].permute(1,2,0).detach().cpu()[:,:,0])
        plt.subplot(1,3,2)
        plt.title('Ground Truth')
        plt.plot(mask.permute(1,2,0).detach().cpu()[:,:,0])
        plt.subplot(1,3,3)
        plt.title('Predicted Mask')
        plt.plot(test_outputs[0].permute(1,2,0).detach().cpu()[:,:,0])
        break

metric = sum(dice)/len(loader)
return metric
I genuinely have no idea what I am doing wrong…I tried to copy what others did but that seems to cause more errors… Thank you in advance.
