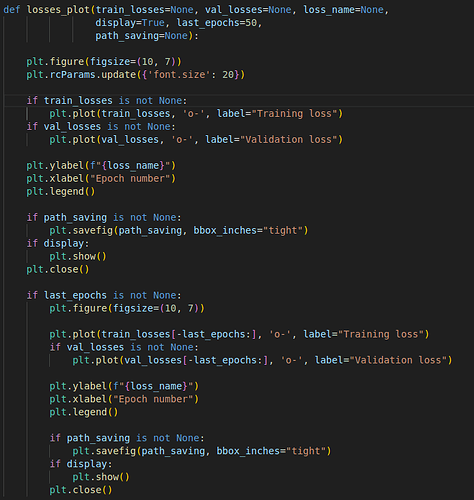
i have a plotting.py script located in my auxiliary folder. two loss function defined in it as follows:
i want to use them to plot my losses in results and use them in my main script:
how can i do that?
for example the code used this method below to plot plot_example_augmentations function:
plotting.plot_example_augmentations(moving_image, fixed_image, os.path.join(path_saving, ‘augmentations_example_img.png’))
