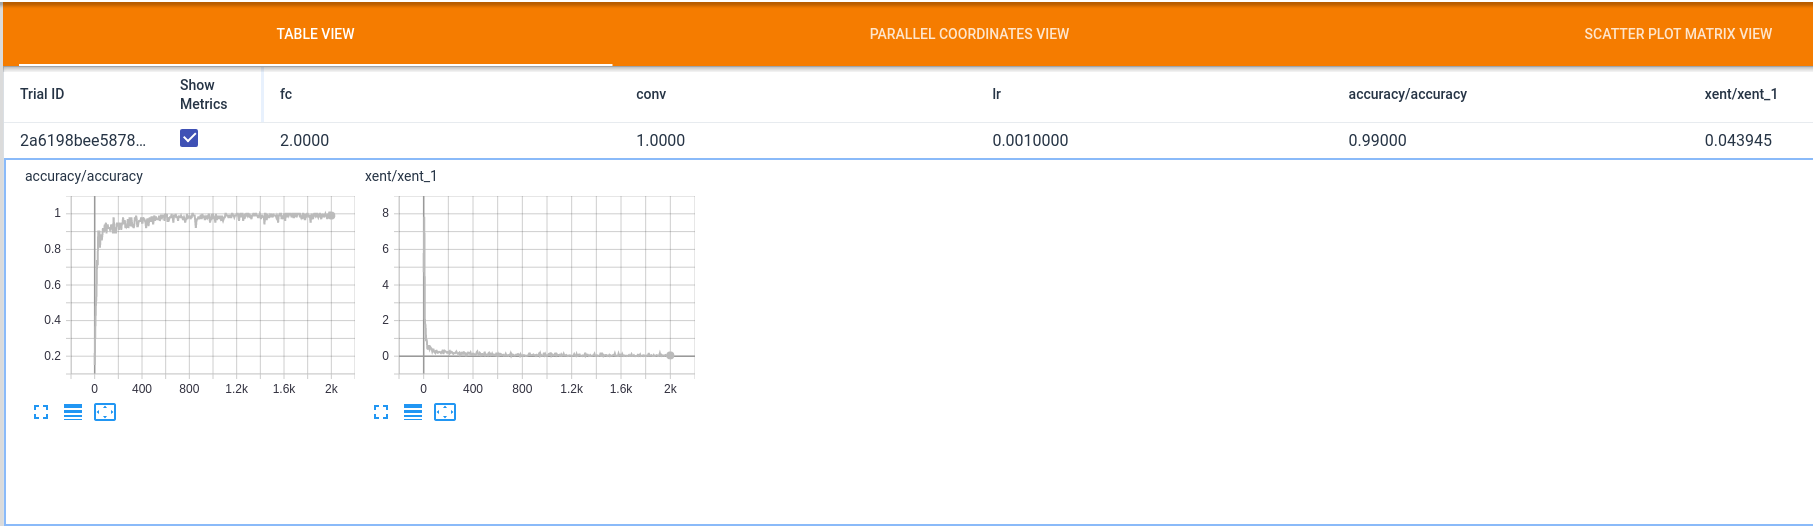
I’m trying to use tensorboard with pytorch and cannot find any clear documentation as to how to add graphs to the hparams dashboard. The image below shows what I want
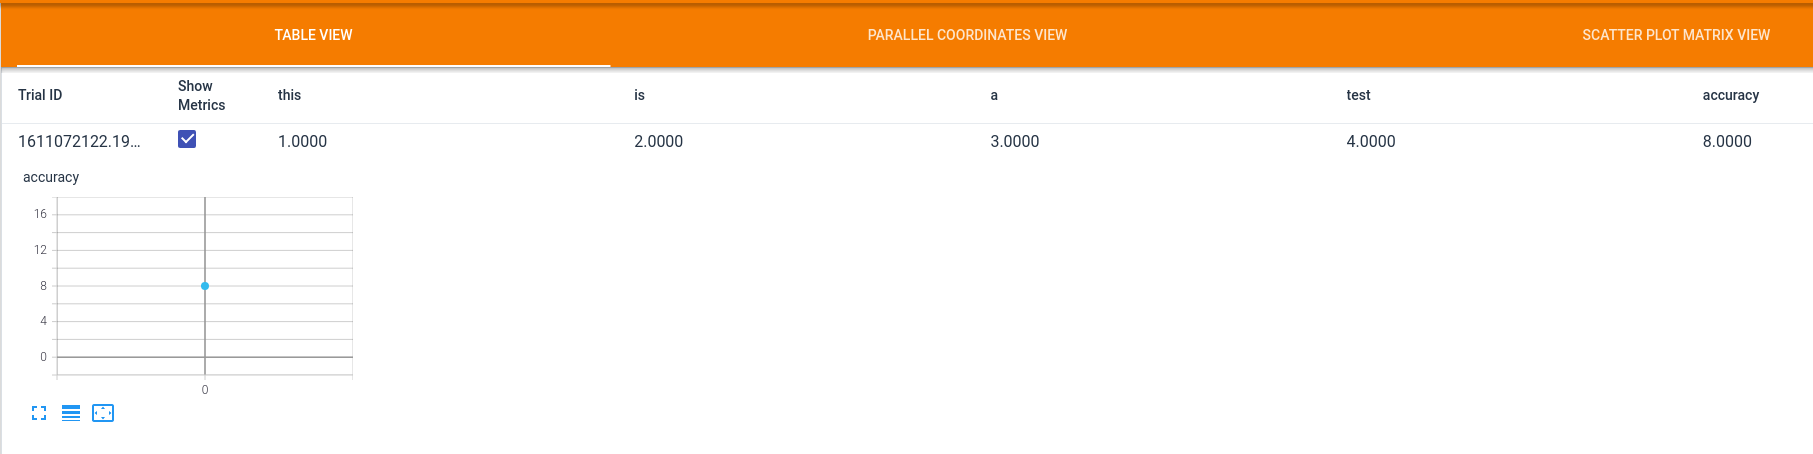
however I can only add singular values for the metrics:
Thanks in advance.
Having dug a little deeper into torch.utils.tensorboard, I can’t seem to find how to use this functionality. However I can achieve it by modifying the SummaryWriter.add_hparams() function as such:
			def add_hparams(self, hparam_dict, metric_dict, hparam_domain_discrete=None, run_name=None):
				torch._C._log_api_usage_once("tensorboard.logging.add_hparams")
				if type(hparam_dict) is not dict or type(metric_dict) is not dict:
					raise TypeError('hparam_dict and metric_dict should be dictionary.')
				exp, ssi, sei = hparams(hparam_dict, metric_dict, hparam_domain_discrete)

				self.file_writer.add_summary(exp)
				self.file_writer.add_summary(ssi)
				self.file_writer.add_summary(sei)
				for k, v in metric_dict.items():
					if v is not None:
						self.add_scalar(k, v)
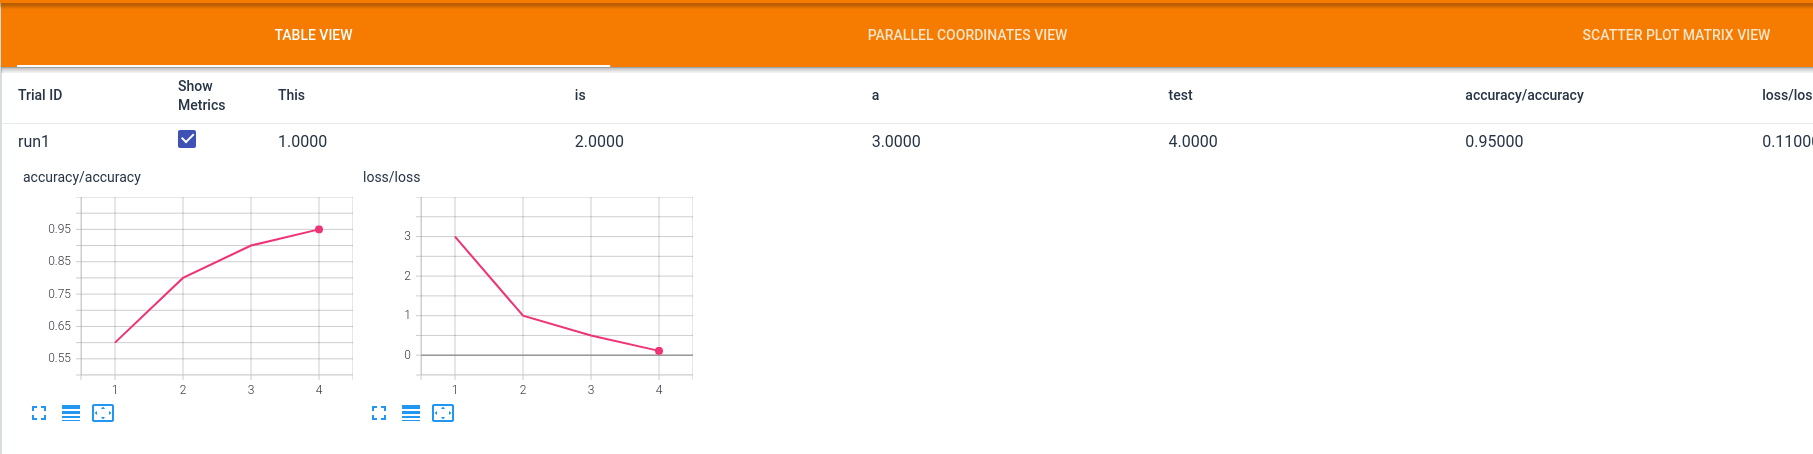
To use this, when you create the SummaryWriter you should set log_dir=log_dir+'/[run_name]'. I have some example code and pictures to show how to use this below.
s = SummaryWriter(log_dir=f'{log_dir}/run1')
h_params = {'This': 1, 'is': 2, 'a': 3, 'test': 4}
metrics = {'accuracy/accuracy': None, 'loss/loss': None}

accuracy_values = [(1, 0.6), (2, 0.8), (3, 0.9), (4, 0.95)]
loss_values = [(1, 3), (2, 1), (3, 0.5), (4, 0.11)]
for step, v in accuracy_values:
	s.add_scalar('accuracy/accuracy', v, step)
for step, v in loss_values:
	s.add_scalar('loss/loss', v, step)

s.add_hparams(h_params, metrics)
s.close()
Something that I’m not sure if it’s a bug or not is that in the original code, any scalars are logged to the log_dir whilst hyper parameters are logged in their own directory and given a run_name.
(I’ve just posted this as hopefully this is useful to someone)
Thanks, this is a massive lifesaver. I think there would definitely be a benefit to rewriting the PyTorch Tensorboard interface to make it more intuitive and increasing the detail of documentation. It shouldn’t be that hard to be able to log metrics on a per-epoch basis with hyperparameters.
“Something that I’m not sure if it’s a bug or not is that in the original code, any scalars are logged to the log_dir whilst hyper parameters are logged in their own directory and given a run_name.” As for this part, this also seems to be a weird default behavior of the add_hyperparameters option to use the log_dir along with the current timestamp (time.time()). See pytorch/writer.py at bf88a4dad5b3c06f43a9ce07a51ec0ab0dbfe2d3 · pytorch/pytorch · GitHub. A quick fix is to just delete those lines and just use the original log_dir.
How can I plot multiple graph in one plot?
I tried these below.
    def add_hparams(self, param_dict, metrics_dict, step=None):
        exp, ssi, sei = hparams(param_dict, metrics_dict)

        self.writer.file_writer.add_summary(exp)
        self.writer.file_writer.add_summary(ssi)
        self.writer.file_writer.add_summary(sei)

        if step is not None:
            for k, v in metrics_dict.item() :
                self.writer.add_scalar(k, v, step)
but if I set the metrics_dict = {‘train_loss’ : train_loss, ‘valid_loss’ : valid_loss}, than there are two plot in board.
    def add_hparams(self, param_dict, metrics_dict, step=None):
        exp, ssi, sei = hparams(param_dict, metrics_dict)

        self.writer.file_writer.add_summary(exp)
        self.writer.file_writer.add_summary(ssi)
        self.writer.file_writer.add_summary(sei)

        if step is not None:
            self.writer.add_scalars('loss', metrics_dict, step)
and if I set the metrics_dict = {‘loss’ : {‘train_loss’ : train_loss, 'valid_loss : valid_loss}} than It not works… (board can show valid loss only)