How to assign labels in confusion matrix?

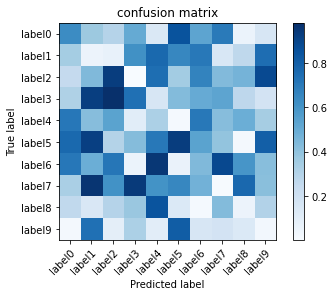
Hi there I am using numerical labels so the confusion matrix looks like this
image
what to do to make this labelling as text.
I am using the code below for confusion matrix.

def plot_confusion_matrix(ts_labels_emotion, y_pred, classes,
                          normalize=False,
                          title=None,
                          label_encoder={0: 'Neutral', 1: 'Calm', 2: 'Happy',3:'Sad',3:'Angry',4:'Fear',5:'Disgust',6:'Surprised'},
                          cmap=plt.cm.Blues):
    """
    This function prints and plots the confusion matrix.
    Normalization can be applied by setting `normalize=True`.
    """
    if not title:
        if normalize:
            title = 'Normalized confusion matrix'
        else:
            title = 'Confusion matrix, without normalization'

    # Compute confusion matrix
    cm = confusion_matrix(ts_labels_emotion, y_pred)
    # Only use the labels that appear in the data
    classes = unique_labels(y_pred)
    if normalize:
        cm = cm.astype('float') / cm.sum(axis=1)[:, np.newaxis]
        print("Normalized confusion matrix")
    else:
        print('Confusion matrix, without normalization')

    print(cm)

    fig, ax = plt.subplots()
    im = ax.imshow(cm, interpolation='nearest', cmap=cmap)
    ax.figure.colorbar(im, ax=ax)
    # We want to show all ticks...
    ax.set(xticks=np.arange(cm.shape[1]),
           yticks=np.arange(cm.shape[0]),
           # ... and label them with the respective list entries
           xticklabels=classes, yticklabels=classes,
           title=title,
           ylabel='True label',
           xlabel='Predicted label')

    # Rotate the tick labels and set their alignment.
    plt.setp(ax.get_xticklabels(), rotation=45, ha="right",
             rotation_mode="anchor")

    # Loop over data dimensions and create text annotations.
    fmt = '.2f' if normalize else 'd'
    thresh = cm.max() / 2.
    for i in range(cm.shape[0]):
        for j in range(cm.shape[1]):
            ax.text(j, i, format(cm[i, j], fmt),
                    ha="center", va="center",
                    color="white" if cm[i, j] > thresh else "black")
    fig.tight_layout()
    return ax


np.set_printoptions(precision=2)

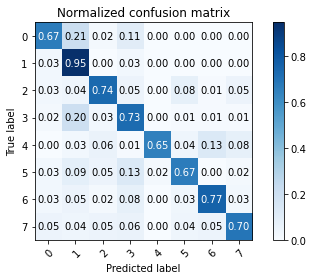
But I think this label encoder is not working. Any suggestions. @ptrblck sir can you plz suggest anything here, how to change this number into text labels in plotting confusion matrix.
Regards

This question seems more matplotlib-related so, you might generally get a faster and better answer in their discussion boards or e.g. StackOverflow.
That being said, you can use ax.set_xticklabels(labels) to set the labels for an axis.
Based on your code snippet, I guess you might need to modify xticklabels=classes, yticklabels=classes.

completely unrelated, but what fmt stands for?

Most likely it stands for “format” and is used to format the text.

1 Like

@ptrblck Ya i think so. but still I didt get the answer. Tried in that forum too :frowning:
Now I am thinking to use photoshop kinda thing in writing paper.

Where have you asked?
Your code seems to work and is using rotated text labels:

x = np.random.uniform(0, 1, (10, 10))

fig, ax = plt.subplots()
im = ax.imshow(x, interpolation='nearest', cmap=plt.cm.Blues)
ax.figure.colorbar(im, ax=ax)

classes = ['label{}'.format(i) for i in range(10)]
title = 'confusion matrix'
# We want to show all ticks...
ax.set(xticks=np.arange(x.shape[1]),
       yticks=np.arange(x.shape[0]),
       # ... and label them with the respective list entries
       xticklabels=classes, yticklabels=classes,
       title=title,
       ylabel='True label',
       xlabel='Predicted label')

# Rotate the tick labels and set their alignment.
plt.setp(ax.get_xticklabels(), rotation=45, ha="right",
         rotation_mode="anchor")

image

1 Like

Thank you sir, You saved me
Big Thanks
Regards

Good to hear it’s working, but I was really just reusing your code. :wink:

A huge thanks for this discussion. As a newbie I was very interesting to read

1 Like