Dear community,
I am trying to solve a simlpe PDE using PINN. My PDE is a 1D heat transfer:
dT/dt = lamda/(rho*cp) * d2T/dt2
I tried some simple finite difference siólutions and it worked out for me:
import torch
import torch.nn as nn
import matplotlib.pyplot as plt
import numpy as np
from pyDOE import lhs
######### Finite difference solutiongeometry:
L = 0.1 # length of the rod
mesh:
dx = 0.001
nx = int(L/dx) + 1
x = np.linspace(0, L, nx)temporal grid:
t_sim = 60
dt = 0.01
nt = int (t_sim/dt)parametrization
rho, lamda, cp = 1, 1, 1
IC
t_ic = 50
BC
t_left = 70 # left side with 60 °C temperature
t_right = 40 # right side with 40 °C temperatureResults
T = np.ones(nx) * t_ic
all_T =
for i in range (0, nt):
Tn = T.copy()
T[1:-1] = Tn[1:-1] + dt/(dx++2) * (lamda/cp) * (Tn[2:] - 2*Tn[1:-1] + Tn[0:-2])
T[0] = t_left
T[-1] = t_right
#T[-1] = T[-2] # Neumann
all_T.append(Tn)
x = torch.linspace(0, L, nx, dtype=torch.float32)
t = torch.linspace(0, t_sim, nt, dtype=torch.float32)
T, X = torch.meshgrid(t,x)
Temps = np.concatenate (all_T).reshape(nt,nx)
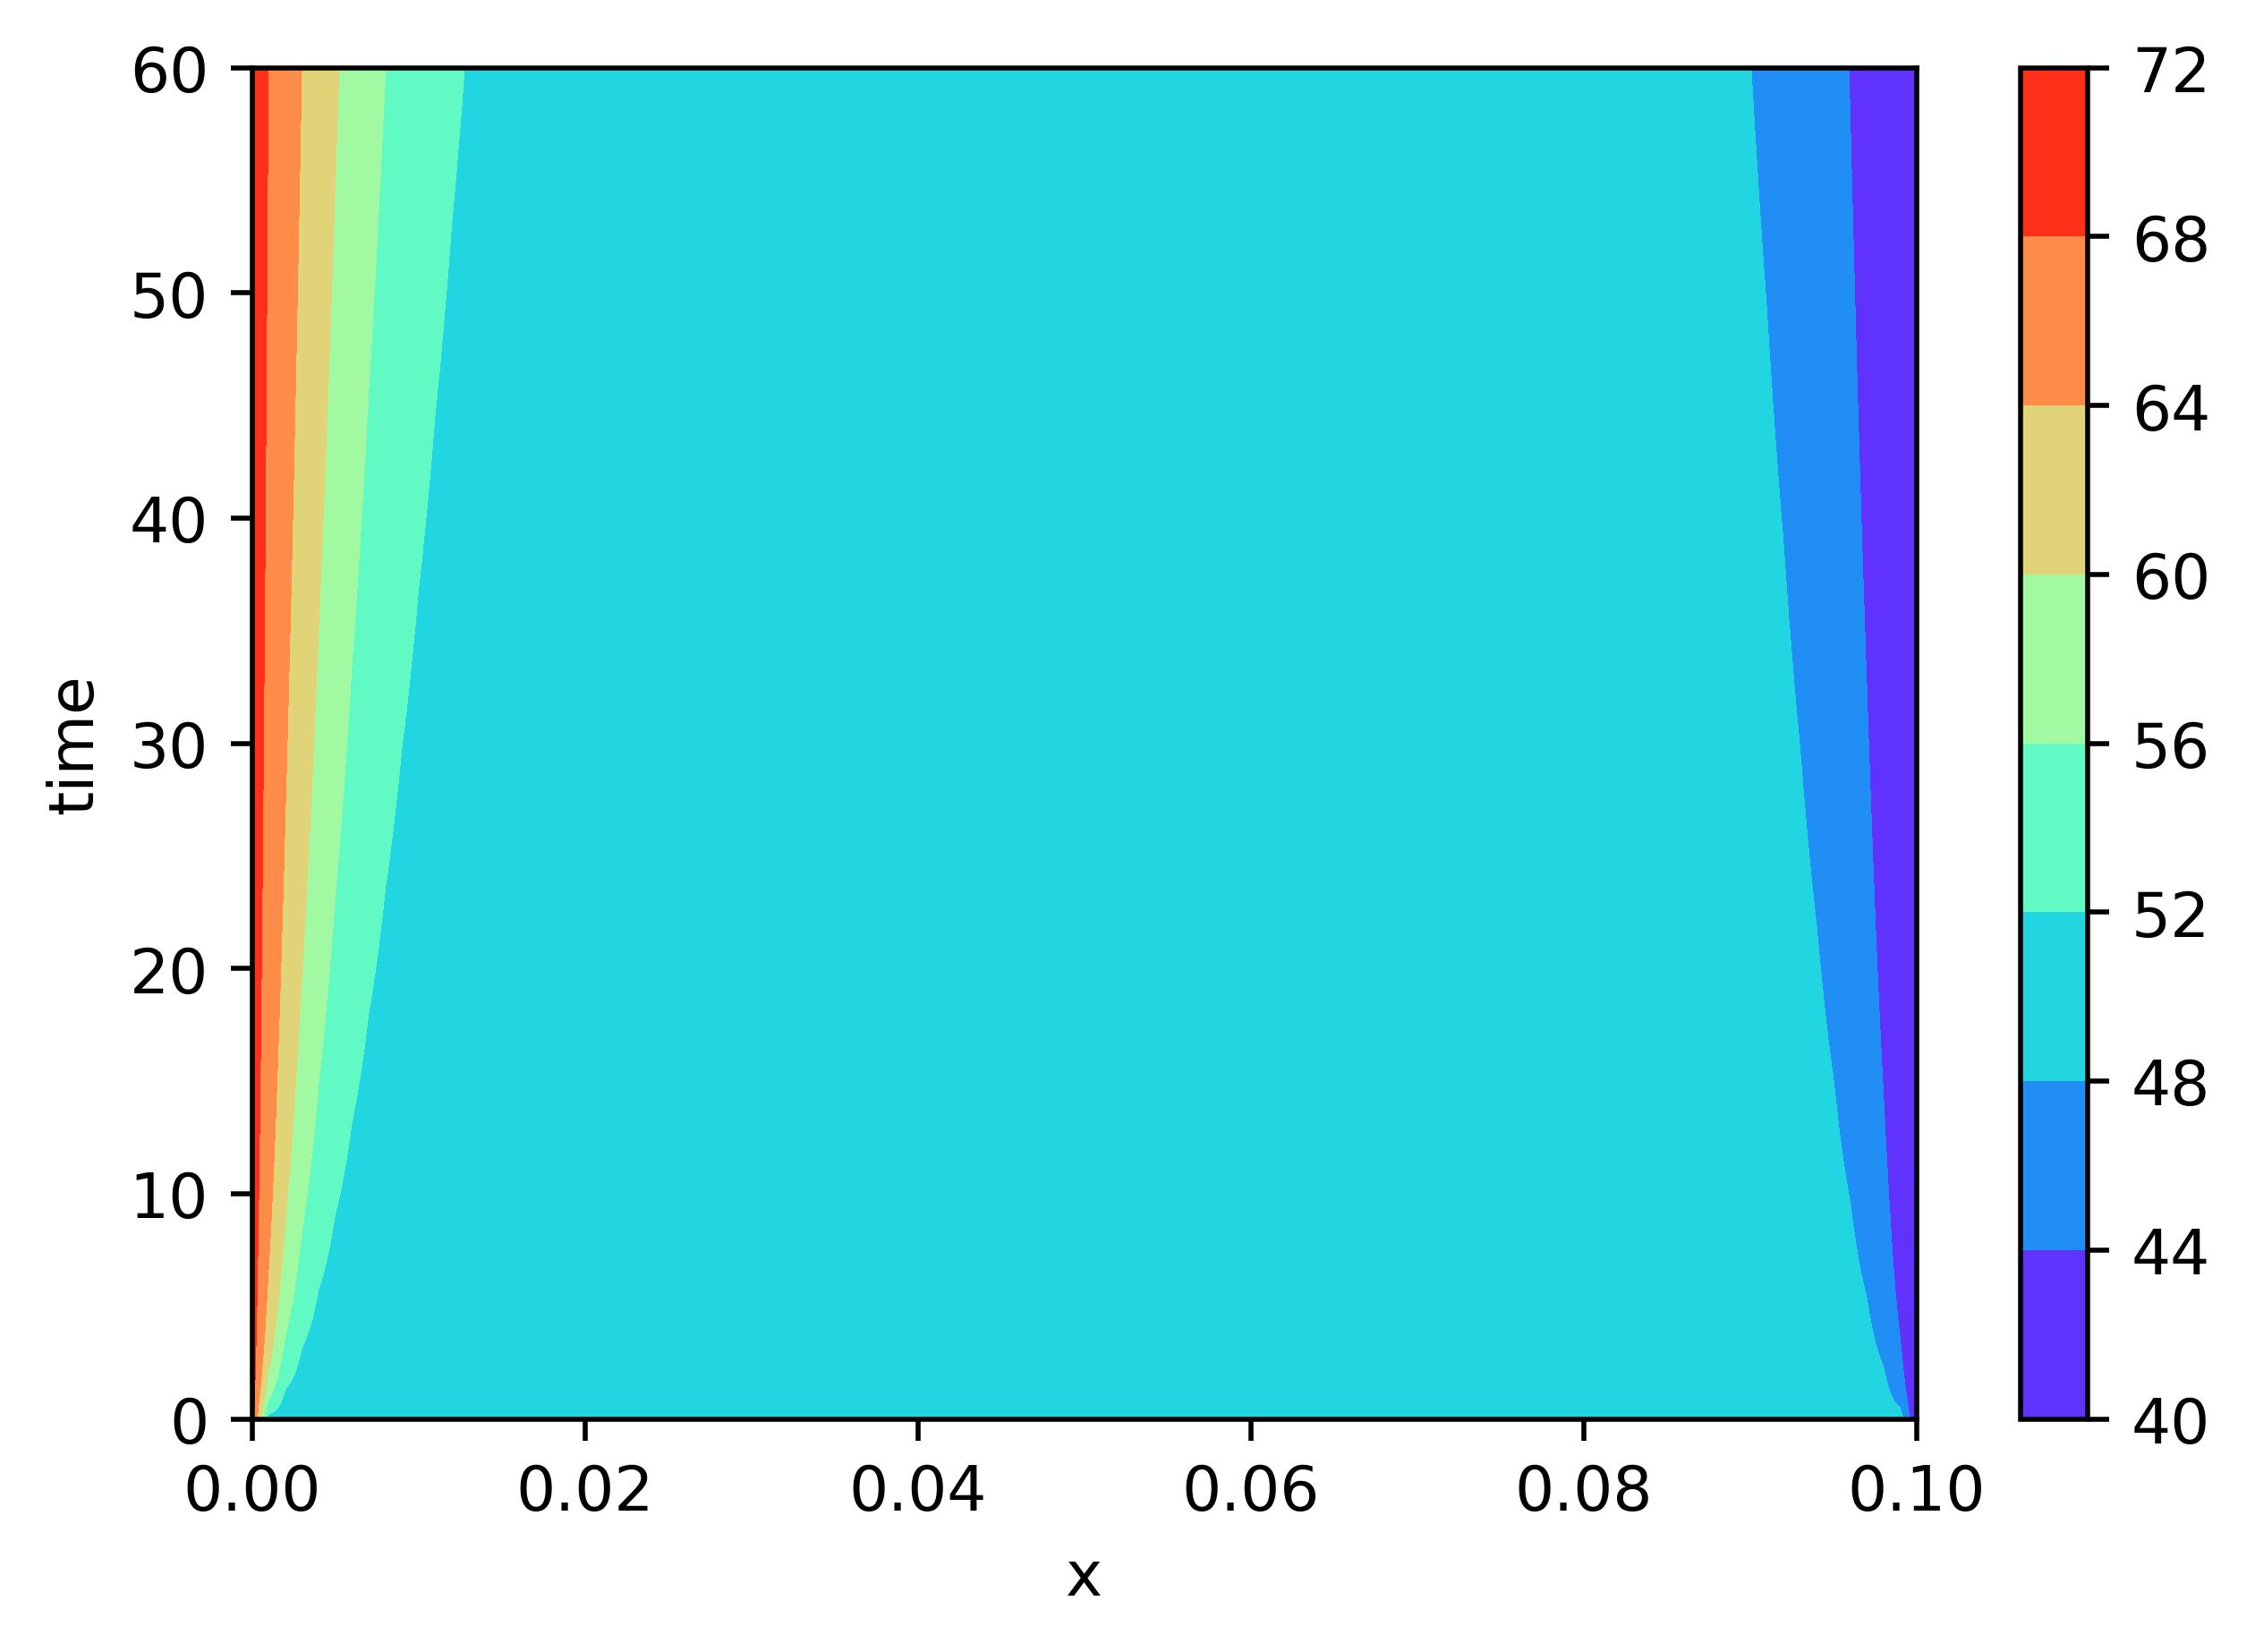
The following code visualizes the results:
fig,ax=plt.subplots(1,1)
cp = ax.contourf(X, T, Temps, cmap=“rainbow”)
fig.colorbar(cp) # Add a colorbar to a plot
ax.set_xlabel(‘x’)
ax.set_ylabel(‘time’)
plt.show()
Which is somthing like:
Then, I tried to solve the same PDE using PINN but results are not acceptable at all. This is my code:
x_test = torch.hstack((X.transpose(1,0).flatten()[:,None], T.transpose(1,0).flatten()[:,None]))
y_test = torch.from_numpy(Temps) # I suppose it is the ground truth
lb = x_test[0] # lower boundary
ub = x_test[-1] # upper boundary
left_x = torch.hstack((X[:,0][:,None], T[:,0][:,None])) # x and t of left boundary
left_y = torch.ones(left_x.shape[0], 1) * t_left # Temperature of left boundary
right_x = torch.hstack((X[:,-1][:,None], T[:,0][:,None])) # x and t of right boundary
right_y = torch.ones(right_x.shape[0], 1) * t_right # Temperature of right boundary
bottom_x = torch.hstack((X[0,1:-1][:,None], T[0,1:-1][:,None])) # x and t of IC
bottom_y = torch.ones(bottom_x.shape[0], 1) * t_ic # Temperature of IC
X_train = torch.vstack([left_x, right_x, bottom_x]) # all of the BCs and IC
Y_train = torch.vstack([left_y, right_y, bottom_y])
No = 100
idx = np.random.choice(left_x.shape[0], No, replace=False)
X_train_No = X_train[idx,:] # random points of BC and IC for training
Y_train_No = Y_train[idx,:]
N_f = 750
X_train_Nf = lb + (ub-lb)lhs(2,N_f)
X_train_Nf = torch.vstack((X_train_Nf, X_train_No)) # random points of domain for training
f_hat = torch.zeros(X_train_Nf.shape[0],1, dtype=torch.float32) # zero array for loss of PDE
class FCN(nn.Module):
##Neural Network
def init(self,layers):
super().init() #call init from parent class
self.activation = nn.Tanh()
self.loss_function = nn.MSELoss(reduction =‘mean’)
‘Initialise neural network as a list using nn.Modulelist’
self.linears = nn.ModuleList([nn.Linear(layers[i], layers[i+1]) for i in range(len(layers)-1)])
self.iter = 0
‘Xavier Normal Initialization’
for i in range(len(layers)-1):
nn.init.xavier_normal_(self.linears[i].weight.data, gain=1.0)
nn.init.zeros_(self.linears[i].bias.data)
‘foward pass’
def forward(self,x):
if torch.is_tensor(x) != True:
x = torch.from_numpy(x)
a = x.float()
for i in range(len(layers)-2):
z = self.linearsi
a = self.activation(z)
a = self.linears-1
return a
‘Loss Functions’
#Loss BC
def lossBC(self,x_BC,y_BC):
loss_BC=self.loss_function(self.forward(x_BC),y_BC)
return loss_BC
#Loss PDE
def lossPDE(self,x_PDE):
g=x_PDE.clone()
g.requires_grad=True # Enable differentiation
f=self.forward(g)
f_x_t=torch.autograd.grad(f,g,torch.ones([g.shape[0],1]),retain_graph=True, create_graph=True)[0] #first derivative
f_xx_tt=torch.autograd.grad(f_x_t,g,torch.ones(g.shape), create_graph=True)[0]#second derivative
f_t = f_x_t[:,[1]]
f_xx = f_xx_tt[:,[0]]
f = f_t - (1/(11))*f_xx
return self.loss_function(f,f_hat)def loss(self,x_BC,y_BC,x_PDE): loss_bc=self.lossBC(x_BC.float(),y_BC.float()) loss_pde=self.lossPDE(x_PDE.float()) return loss_bc.float()+loss_pde.float()layers=np.array([2, 50, 50, 50, 50, 1])
PINN=FCN(layers)
optimizer = torch.optim.Adam(PINN.parameters(), lr=0.001)
def closure():
optimizer.zero_grad()
loss = PINN.loss(X_train_No, Y_train_No, X_train_Nf)
loss.backward()
return loss
for i in range(10000):
loss = optimizer.step(closure)
if (i+1)%2500==0:
with torch.no_grad():
test_loss=PINN.lossBC(x_test,y_test.flatten().view(-1,1))
print(‘Training:’, loss.cpu().detach().numpy(), ‘/ Testing’, test_loss.cpu().detach().numpy())
y1 = PINN(x_test)
arr_y1 = np.array (y1.reshape(shape=[nx,nt]).transpose(1,0).detach())
fig,ax=plt.subplots(1,1)
cp = ax.contourf(X, T, arr_y1, cmap=“rainbow”)
fig.colorbar(cp) # Add a colorbar to a plot
ax.set_xlabel(‘x’)
ax.set_ylabel(‘time’)
plt.show()
Sorry for raising suchlong problem, I very much appreciate any help.