Hi,
I have created simple training accuracy/loss graphs and validation accuracy/loss graphs.
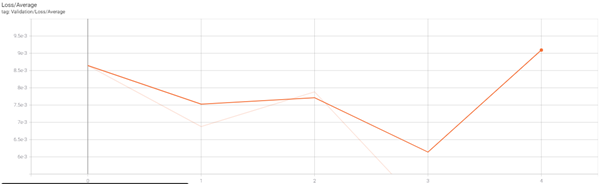
The x-axis is displayed in exponential format.
I would like to know how to change it to float format
Image of graph
Code to write the graphs on tensorboard:
board_writer.add_scalar(f'Validation/Loss/Average', val_loss_in_this_epoch/no_of_batches_in_this_epoch, epoch)
board_writer.add_scalar(f'Validation/Accuracy/Average', val_correct_in_this_epoch/(no_of_batches_in_this_epoch*batch_size), epoch)
board_writer.add_scalar(f'Validation/TimeTakenInMinutes', (time()-start_time)/60, epoch)
board_writer.flush()