0
I’m working on a multilabel classification task with 14 different disease classes. I’ve trained my model, and I want to generate a single multilabel confusion matrix where both the x-axis and y-axis represent the 14 classes.
However, when I try to generate the confusion matrix using my current code, it creates a separate confusion matrix for each class. Instead, I would like a unified confusion matrix where the true labels and predicted labels are across the same 14 classes on both axes.
Here are the key details of my setup:
- I’m using PyTorch.
- I have a trained model and access to train_loader.
- I’ve successfully used my model for prediction, but I’m stuck on how to aggregate the results into a single confusion matrix for multilabel classification.
Here’s the code I’m using to generate the confusion matrix:
import numpy as np
import matplotlib.pyplot as plt
from sklearn.metrics import multilabel_confusion_matrix

# Initialize lists to store true labels and predictions
all_labels = []
all_predictions = []

# Disable gradient calculation for inference
with torch.no_grad():
    for images, labels in test_loader:
        images, labels = images.to(device), labels.to(device)

        # Forward pass to get model predictions
        outputs = best_model(images)

        # Store true labels and predicted probabilities
        all_labels.extend(labels.cpu().numpy())
        all_predictions.extend(outputs.cpu().numpy())  # Get the raw output (probabilities)

# Convert to numpy arrays for easier manipulation
all_labels = np.array(all_labels)
all_predictions = np.array(all_predictions)

# Apply thresholding to convert probabilities to binary predictions
binary_predictions = (all_predictions > 0.5).astype(int)

# Compute the multilabel confusion matrix
confusion_mtx = multilabel_confusion_matrix(all_labels, binary_predictions)

# Function to plot the multilabel confusion matrix
def plot_multilabel_confusion_matrix(confusion_mtx, class_names):
    num_classes = confusion_mtx.shape[0]
    ncols = 3  # Set the number of columns for the plot
    nrows = (num_classes + ncols - 1) // ncols  # Calculate the number of rows needed

    fig, axes = plt.subplots(nrows=nrows, ncols=ncols, figsize=(ncols * 4, nrows * 4))
    axes = axes.flatten()  # Flatten the 2D array of axes for easy iteration

    for i in range(num_classes):
        ax = axes[i]
        ax.matshow(confusion_mtx[i], cmap=plt.cm.Blues, alpha=0.5)
        ax.set_xlabel('Predicted')
        ax.set_ylabel('True')
        ax.set_title(class_names[i])

        # Set x and y axis ticks to show "Positive" first and "Negative" second
        ax.set_xticks([0, 1])
        ax.set_xticklabels(['Positive', 'Negative'])  # Positive first
        ax.set_yticks([0, 1])
        ax.set_yticklabels(['Positive', 'Negative'])  # Positive first

        # Show the counts
        for j in range(confusion_mtx[i].shape[0]):
            for k in range(confusion_mtx[i].shape[1]):
                ax.text(k, j, confusion_mtx[i][j, k], ha='center', va='center')

    # Hide any unused subplots
    for i in range(num_classes, len(axes)):
        axes[i].axis('off')

    plt.tight_layout()
    plt.show()

# Plot the multilabel confusion matrix
plot_multilabel_confusion_matrix(confusion_mtx, class_names)
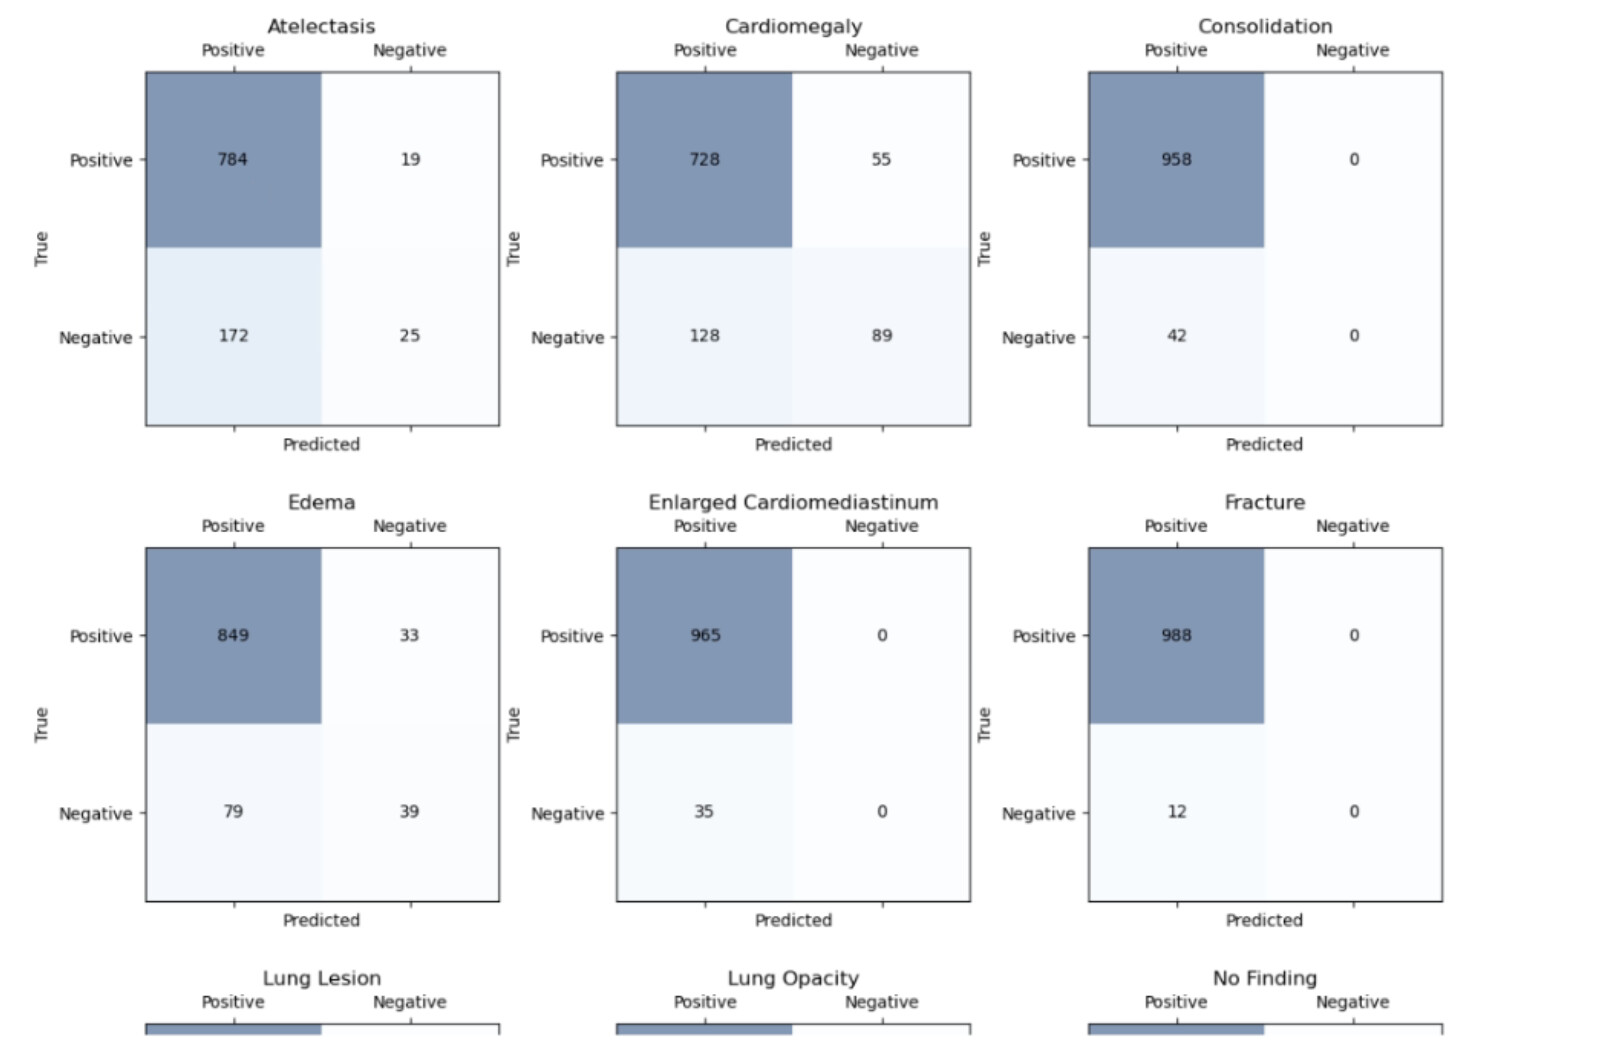
What I get is 14 separate confusion matrices, but I need a single confusion matrix with all 14 classes represented on both axes.
Here’s an image of what I’m getting:
And here’s what I want:
