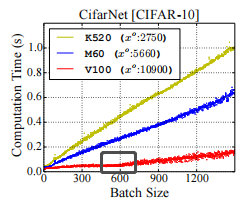
I find that sometimes increasing the batch size will not increment the batch processing time significantly. For example, in this figure, the batch sizes smaller than 600 don’t impact the batch processing time somehow in V100.
My question is, is it possible for me to calculate the maximum batch size that doesn’t change the batch processing time, given the GPU information and the model information trained in Pytorch? Which metric of GPU significantly impacts this saturation?
One thumb rule is to maximize your GPU’s memory usage. Run a simple binary search to identify this number. The GPU memory is occupied by not just the input data but also network weights (and activations if not using inside torch.no_grad or torch.inference_mode).
The two metrics that are commonly used during inference are throughput which denotes how many samples are inferenced in a unit time (you want this to be high), and latency the time taken to process a single sample (batch_sz = 1).
Does running a grid search of batch sizes and identifying the max batch size give you consistent results? Something like
def proc_time(b_sz, model, n_iter=10):
    x = torch.rand(b_sz, 3, 224, 224).cuda()
    torch.cuda.synchronize()
    start = time.time()
    for _ in range(n_iter):
        model(x)
    torch.cuda.synchronize()
    end = time.time() - start
    throughput = b_sz * n_iter / end
    print(f"Batch: {b_sz} \t {throughput} samples/sec")
    return (b_sz, throughput, )
Plotting these might give you a hump, take the maxima for most efficiency!
Binary search does help me decrease the searching time. But I am still wondering if there is a graceful way to deterministically find such an inflection point for a given model type and GPU type?
By the way, I find that I forgot to post a figure. I have attached a figure illustrating such an inflection point now.
The proper way would be to profile the actual workload on your device.
E.g. the lower bound visible in the attached figure could be the constant kernel launch overhead.
Once you scale up the workload you might be seeing e.g. quantization effects.