How to draw the normal distribution parameter distribution chart of VAE model?

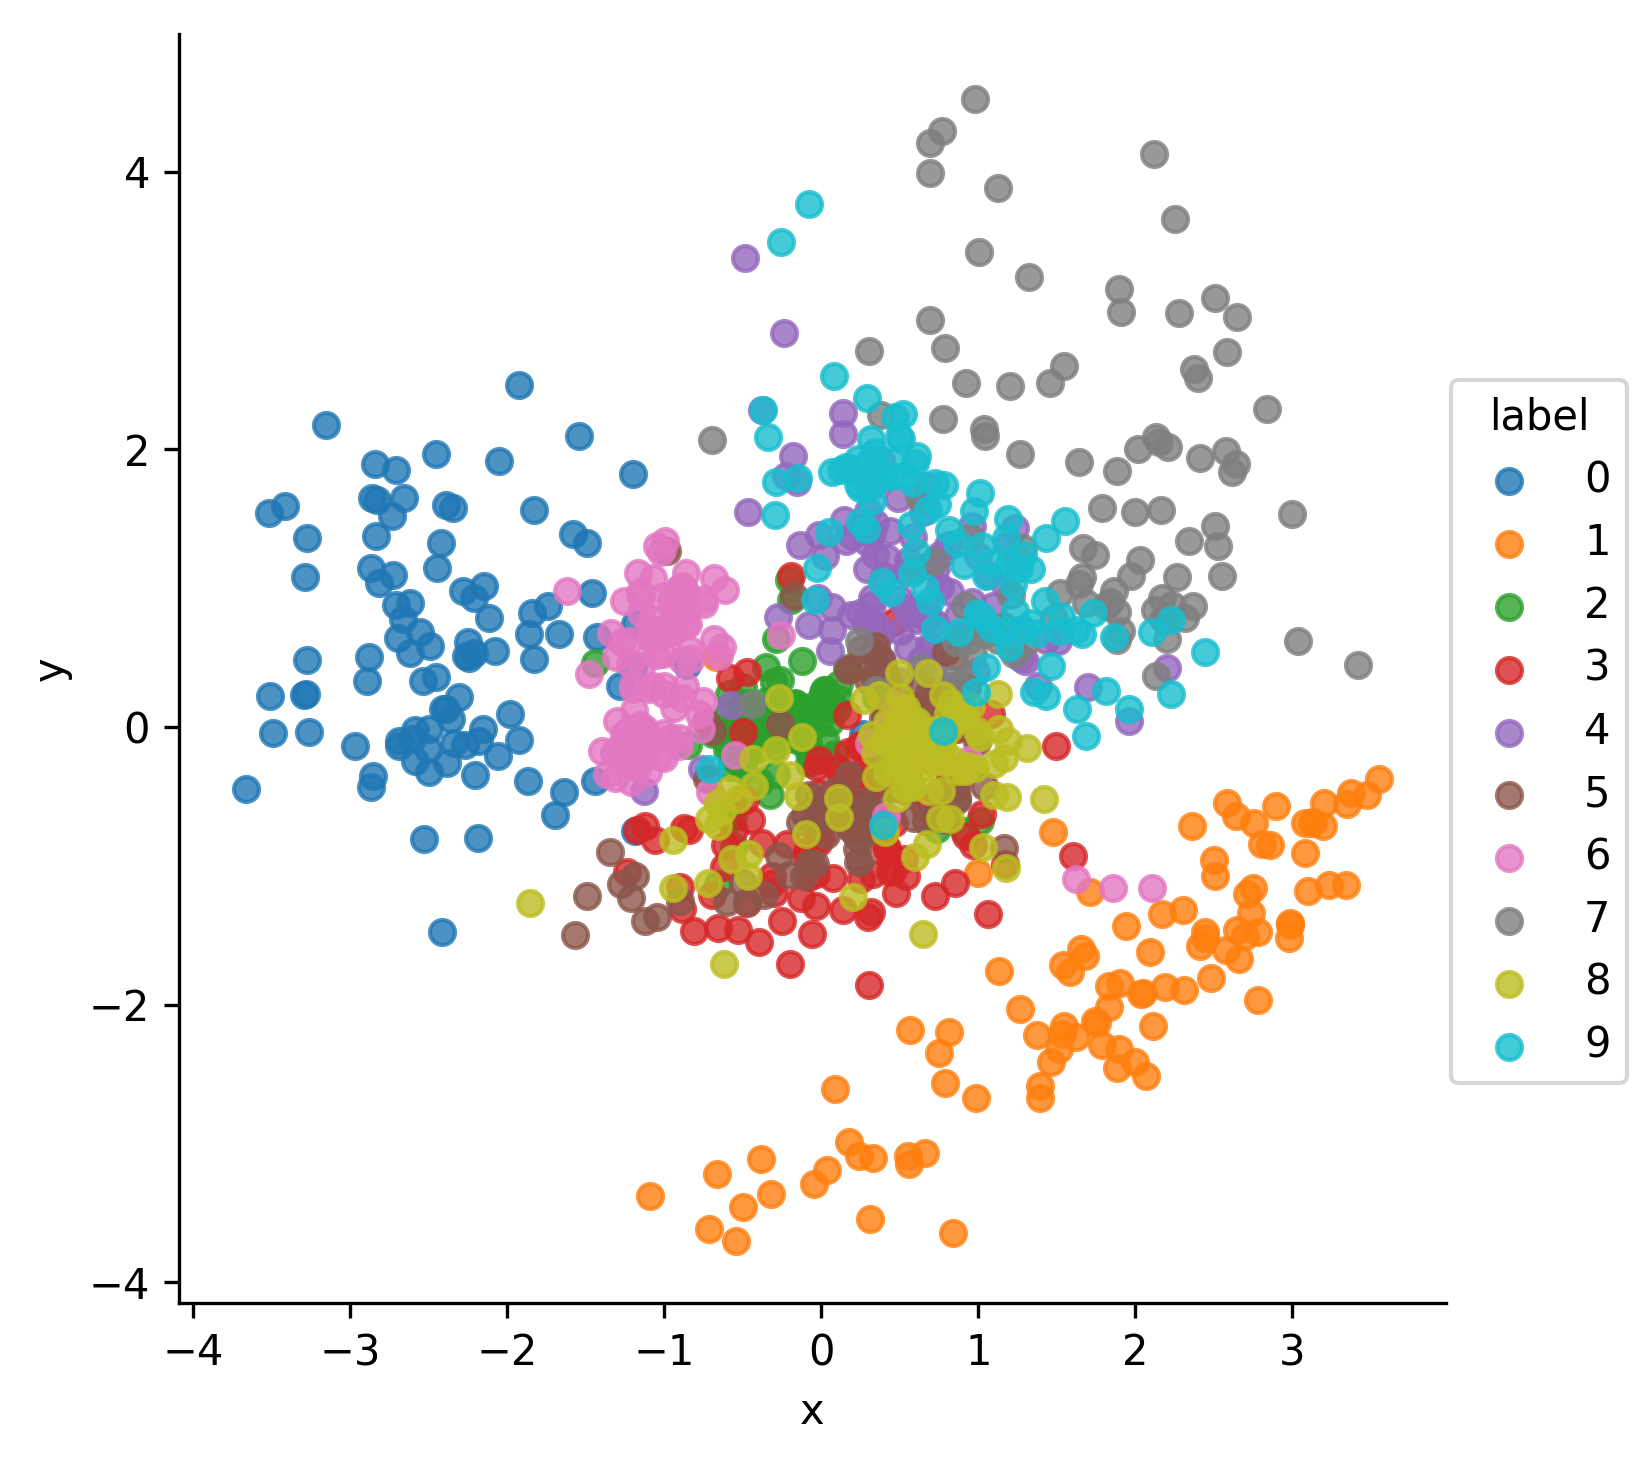
At present, referring to the code here, the VAE model is implemented. Next I want to try to draw a distribution map of the normal distribution parameters in the VAE model. According to the current understanding and reference here, it should be possible to draw the following coordinate chart.


My question is,

  1. What is the abscissa and ordinate coordinates of this graph that can be drawn through the VAE model?
  2. What changes are needed / should be made for the code referenced above?
  1. I guess the image shows the mapping of some inputs (and their classes) using some dimensionality reduction technique such as PCA or TSNE. The axes could be the two highest principle components.

  2. You could return the latent output of your VAE and use e.g. sklearn.decomposition.PCA or sklearn.manifold.TSNE to reduce the dimensions.

There is a pull request for VAE example, which I guess has what you need, its not yet been merged , but it should work just fine : https://github.com/pytorch/examples/pull/632
have a look