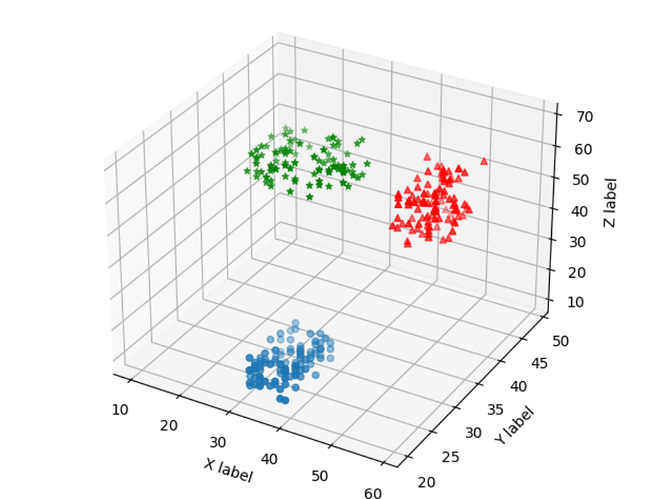
I hope that there are some methods to show the prediction results of certain dataset. Those datasets have ten different labels. So the prediction results of one model also have ten point. I found some methods to draw point with three dim. However, I did not know how to convert the 10-D point to 3-D point reasonably.
