Hi everyone,
I am implementing a system for a Graph Neural Net (GNN) based on PyTorch and PyTorch Geometric (PyG).
Because of my algorithm, I need the system to perform operations that are not normally used in Convolutional Neural nets.
Examples of the functions I use in the code I wrote are:
- torch.unique_consecutive()
- torch.cumsum()
- torch.eq()
Plus, I do have a few for loops in the extra code I wrote (shame on me ).
).
The version of my system prior to the introduction of those operations runs with a GPU utilisation of ~99%, while the new version runs with a utilisation of ~30%. I would like to understand what is causing the low GPU utilisation and if there is a way to make my code run faster.
I can exclude the usual culprit for low GPU utilisation, i.e., time that the GPU spends idle waiting for a minibatch to be loaded to GPU RAM, because all of the data for my current problem resides on GPU RAM.
I tried using the NVIDIA profiler, I instrumented the code so that only one forward pass of the GNN is analysed:
torch.cuda.profiler.cudart().cudaProfilerStart()
 	...useful code here...
 torch.cuda.profiler.cudart().cudaProfilerStop()
 exit()
I show here the results of running the profiler in the two cases.
Old version of the code, which does not feature the code I wrote myself, with the ‘special’ operations:
$ export CUDA_LAUNCH_BLOCKING=1; nvprof -s --export-profile on --profile-from-start off -o main_master.nvvp -f python main.py

           Type  Time(%)      Time     Calls       Avg       Min       Max  Name
 GPU activities:   11.42%  3.9044ms        19  205.50us  1.1840us  1.1311ms  _ZN2at6native29vectorized_elementwise[...]
                   10.98%  3.7539ms         6  625.65us  184.64us  1.5057ms  volta_sgemm_128x128_tn
                   10.47%  3.5787ms        24  149.11us  1.0240us  761.06us  _ZN2at6native29vectorized_elementwise[...]
                   10.11%  3.4564ms        12  288.03us  1.5680us  1.4638ms  _ZN2at6native29vectorized_elementwise_[...]
                    8.19%  2.7999ms        46  60.866us     864ns  414.82us  _ZN2at6native29vectorized_elementwise[...]
                    8.18%  2.7964ms         4  699.11us  154.59us  1.2435ms  volta_sgemm_128x64_tn
                    ...
                    **0.09%**  31.776us        14  2.2690us  1.2160us  2.6240us  [CUDA memcpy HtoD]
                    **0.02%**  6.9120us         6  1.1520us  1.0240us  1.3120us  [CUDA memcpy DtoD]
Current version of the code, which includes the ‘special’ operations:
$ export CUDA_LAUNCH_BLOCKING=1; nvprof -s --export-profile on --profile-from-start off -o main_current.nvvp -f python main.py

            Type  Time(%)      Time     Calls       Avg       Min       Max  Name
 GPU activities:   12.50%  6.1623ms         4  1.5406ms  303.33us  2.7780ms  volta_sgemm_128x128_tn
                    9.61%  4.7417ms      4242  1.1170us     704ns  380.10us  _ZN2at6native29vectorized_elementwise[...]
                    9.19%  4.5337ms         4  1.1334ms  266.08us  2.0008ms  volta_sgemm_128x64_nn
                    **9.00%**  4.4410ms      4810     923ns     800ns  12.384us  [CUDA memcpy DtoD]
                    8.58%  4.2312ms      1803  2.3460us     832ns  1.1516ms  _ZN2at6native29vectorized_elementwise[...]
                    8.09%  3.9914ms         2  1.9957ms  1.9954ms  1.9960ms  volta_sgemm_128x64_nt
                    **4.65%**  2.2946ms      1517  1.5120us     704ns  12.352us  [CUDA memcpy DtoH]
                    ...
                   **0.60%**  313.34us       166  1.8870us     640ns  2.6560us  [CUDA memcpy HtoD]
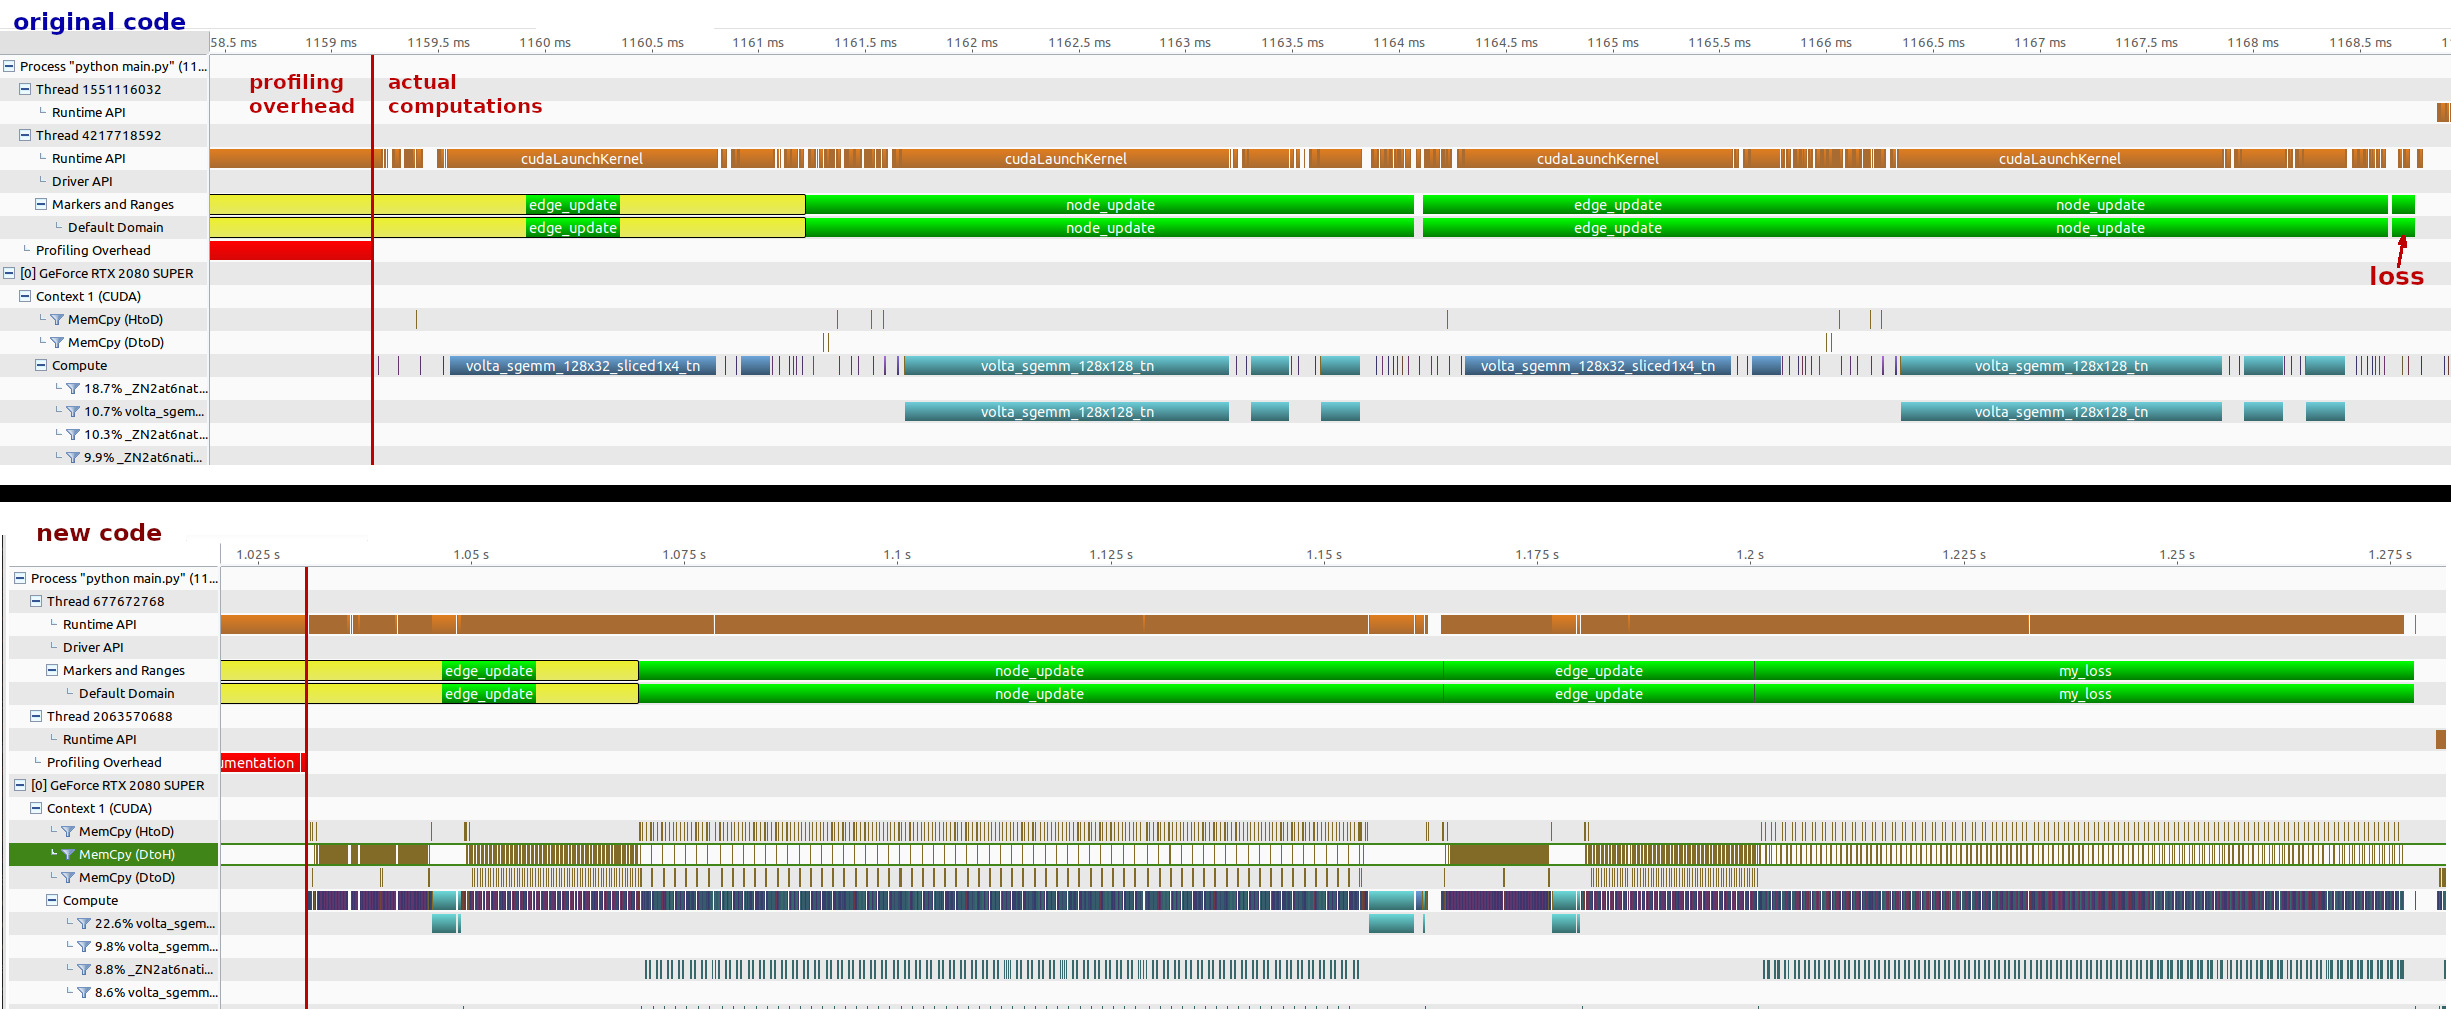
I also used the NVIDIA’s visual profiler:
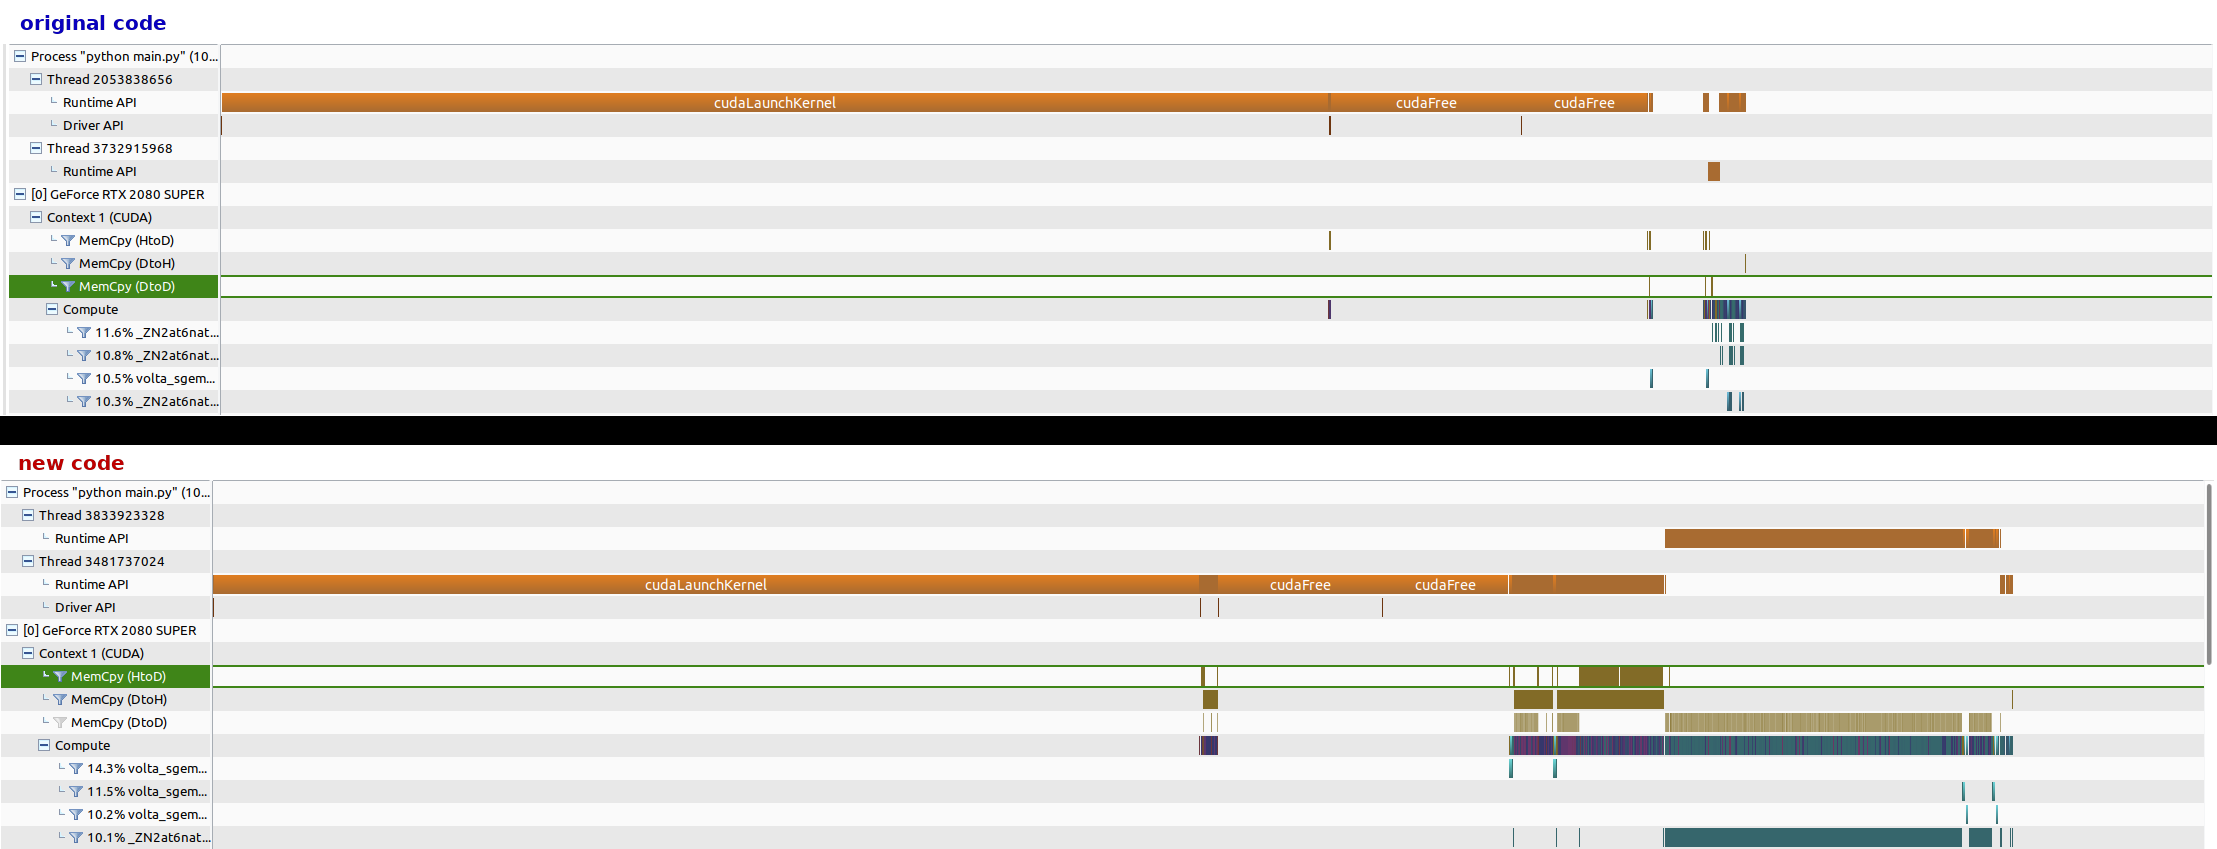
What I understand is that the newly introduced operations are causing small and frequent memory movements, especially between the GPU and the CPU (CUDA memcpy DtoH). This is probably not a very good idea, because those are operations that take time, during which the GPU stays idle.
Can anyone help me understand which of the functions I used is causing that? Pointers to reading materials are welcome.
Thanks everyone in advance!