I am training CGAN for generating Xray images.
My training initializations are as follows:
criterion = nn.BCEWithLogitsLoss()
training samples = 1200
n_epochs = 600
z_dim = 100
batch_size = 50
lr_gen = 0.0002
lr_disc = 0.0001
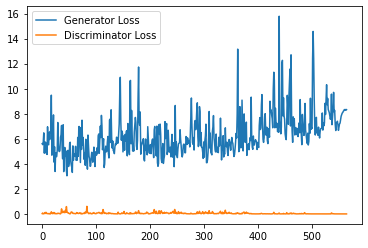
This is the loss graph after 500 epochs. I am not able to interpret whether training is working fine or not. What does this generator’s and discriminator’s graph conclude?
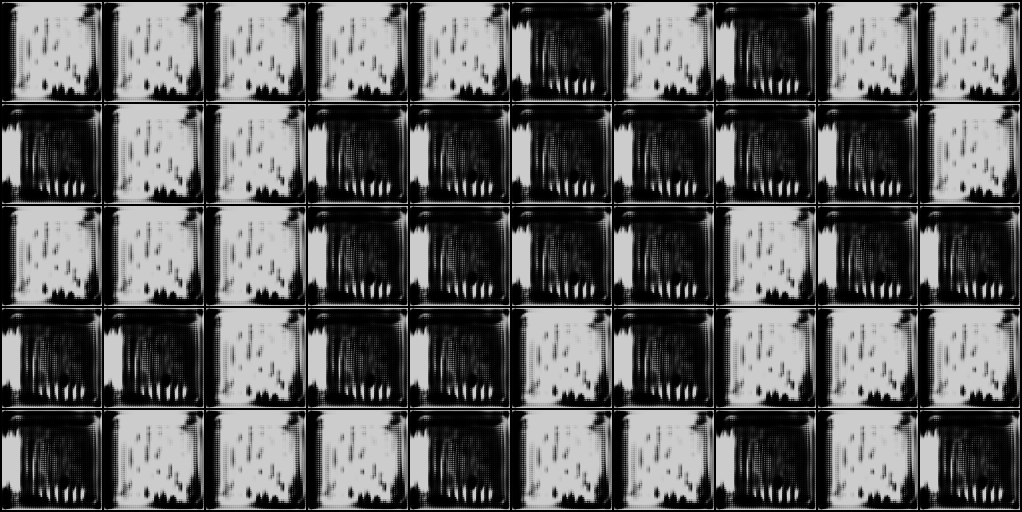
And following is the output of fake images for 554th epoch.