I am trying to train neural networks on gpu devices by a large dataset, and the h2d time for the mini-batch is mostly the same as the training time. So I wonder if there is any way for pytorch to overlap the mini-batch time and the training time, maybe something like multi-processing?
The h2d means: copy the data from cpu to gpu. Like this operation: data = data.cuda()
The h2d time for the minibatch means: the time for copy the data of a minibatch from cpu to gpu.
And the training time means: the time for training the model by the data of a minibatch. The training operation always like this: training_result = model(input_data)
Firstly, we should load our training data of a minibatch to the gpu device by data.cuda() , which cost some time, we just name it h2d_time . And then, we will train our model by model(data) , which cost some time, we juest name it training_time . So, the whole time will be h2d_time + training_time for training one minibatch.
However, I wonder if there is any way to overlap the training_time and the h2d_time . For example, we can load the next minibatch data when the last minibatch data is still training.
Hi,
Thanks for the clear description.
The CUDA is asynchronous for execution by default. So it is already very likely that a lot of overlap is happening.
Note that you should use torch.cuda.synchronize() if you record times on the CPU to make sure you measure the proper time!
You mean that our users do not need do anything for the overlap? Previously, I guess maybe something like multiprocessing would be useful 
By the way, could you please give more details or codes for the use of torch.cuda,synchronize() to record times? Thanks very much.
You mean that our users do not need do anything for the overlap?
No! The CPU will only wait for the GPU to finish computing things when the values are actually needed on the CPU side (when you try to print a Tensor, send it to cpu wit .cpu() or get the content as a python number with .item(), etc).
You can play with this by creating a cuda Tensor and apply simple operations on it and use time.time() to see what takes time (I did not run the code as I don’t have a GPU on this machine, so there might be typo):
import torch
from torch.cuda import synchronize
from time import time
small_tensor = torch.rand(10, device="cuda")
medium_tensor = torch.rand(1000, device="cuda")
# I used random values for the size here, there might need to be bigger for you
# to see a significant difference depending on your GPU
large_tensor = torch.rand(100000, device="cuda")
# Make sure all is properly finished on the GPU side
synchronize()
start = time()
# Do an inplace op to avoid any output allocation overhead
small_tensor.add_(1)
print("Small no sync ", time() - start)
start = time()
# Do an inplace op to avoid any output allocation overhead
medium_tensor.add_(1)
print("Medium no sync ", time() - start)
start = time()
# Do an inplace op to avoid any output allocation overhead
large_tensor.add_(1)
print("Large no sync ", time() - start)
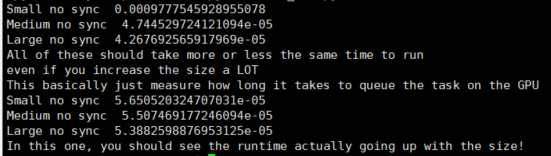
print("All of these should take more or less the same time to run")
print("even if you increase the size a LOT")
print("This basically just measure how long it takes to queue the task on the GPU")
synchronize()
start = time()
# Do an inplace op to avoid any output allocation overhead
small_tensor.add_(1)
synchronize()
print("Small no sync ", time() - start)
synchronize()
start = time()
# Do an inplace op to avoid any output allocation overhead
medium_tensor.add_(1)
synchronize()
print("Medium no sync ", time() - start)
synchronize()
start = time()
# Do an inplace op to avoid any output allocation overhead
large_tensor.add_(1)
synchronize()
print("Large no sync ", time() - start)
print("In this one, you should see the runtime actually going up with the size!")
As a bonus, you can run that with the env variable “CUDA_LAUNCH_BLOCKING=1”. It will force the whole cuda api to be synchronous. And so if you set this, you should see similar results both with and without synchronization.
I just run it. But it seems like the run time go down with the size.
Ok maybe you want to increase the Tensor sizes A LOT 
Thinking back at it, they are very very small.
Maybe do something like a regular image: 1, 3, 240, 240 for the medium and something even bigger for the large
I was testing this, and came up with the following script, which does block on the kernels’ execution, evidenced by the large delay between the prints surrounding the loop:
import torch
from torch.cuda import synchronize

tensor1 = torch.rand((10000,10000), device="cuda")
tensor2 = torch.rand((10000,10000), device="cuda")
tensorres= torch.empty_like(tensor1, device="cuda")
N=10000
print('Waiting for the GPU')
synchronize()
print('Done')

print('Queueing up kernels to the GPU')
for i in range(N):
    tensorres = tensor1*tensor2
print('Done')
The CPU never actually uses the values of the GPU tensors. Any idea why this might be happening?
How did you verify that the launches are blocking?
Profiling your code shows that the CPU can run ahead and add the kernel launches to the queue while the GPU is busy with their execution.
I added a final sync to avoid the script exiting while the GPU isn’t done yet.

I didn’t use the profiler, actually, and was judging off the time it takes to queue the kernels.
Fiddling around a bit more, and using the nsight profiler, I get this interesting behaviour:
With N=1000, queuing up the kernels takes negligible time (~0.005s on my setup)
With N=2000, however, the duration jumps to ~2.3 seconds, so something is going on.
Here are the corresponding nsight timelines, where the top one is for N=1000, and the bottom one is for N=2000 :
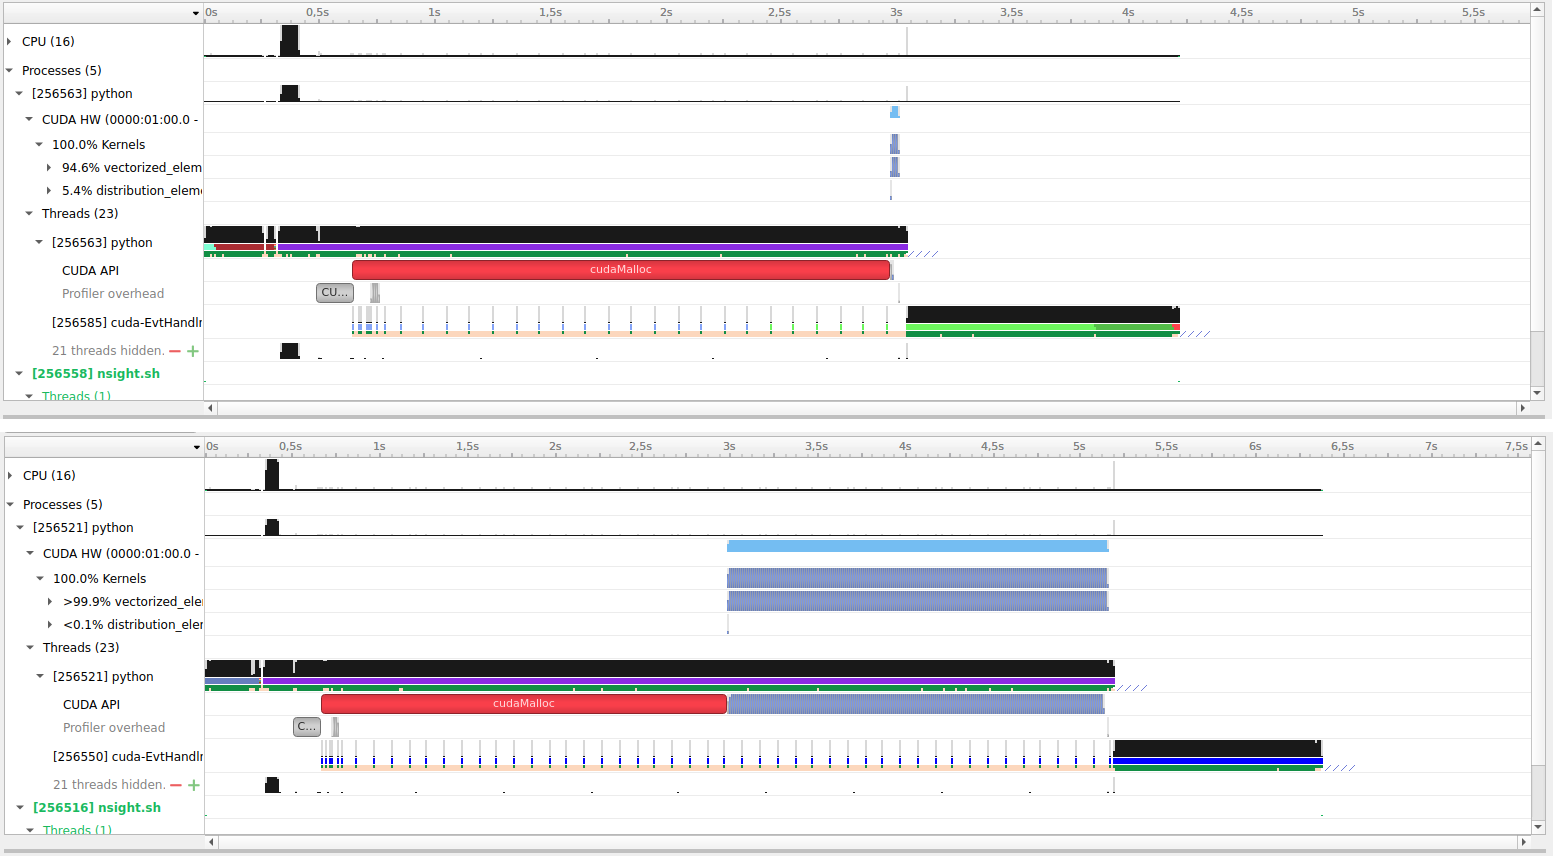
Note that the initialization takes ~3 seconds in both, but after that N=2000 takes significantly more time to queue the kernels, much more than 2x.
Thought that was interesting. It might not be of practical importance to queue thousands of kernels.
I’ve used your previously posted code of N=10000 and didn’t see this behavior, so I don’t know what’s causing the change in your code for N=2000.
That’s odd. So on your setup queuing the kernels takes negligible time even for N=10000?