Hi, all.
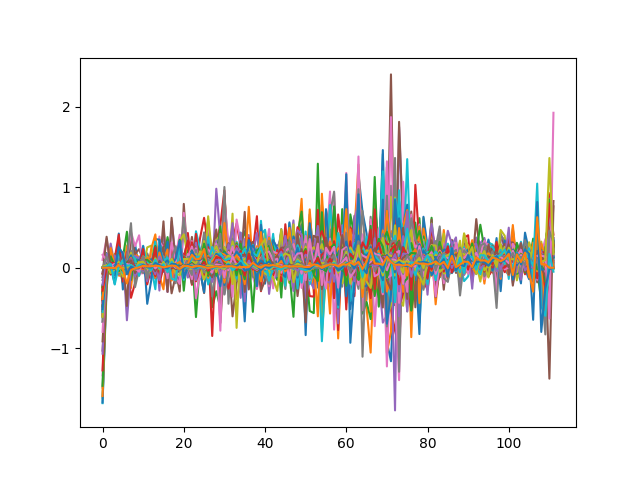
I am currently trying to manipulate feature maps but first I want to visualize feature maps. I followed some instructions and get features I want. But when I plot them out, I dont think it is right. Attached is my code and result.
Any suggestions? Thanks in advance!
from torchvision import models
import foolbox
import torch
import torch.nn as nn
from matplotlib import pyplot as plt


image, label = foolbox.utils.imagenet_example(data_format="channels_first")
image = image/255
image = torch.from_numpy(image)
image = torch.unsqueeze(image, 0)

# remove last fully connected layer
resnet18 = models.resnet18(pretrained=True)
modules = list(resnet18.children())[:-9]
resnet18 = nn.Sequential(*modules)
for p in resnet18.parameters():
    p.requires_grad = False


out = resnet18(image)
out = torch.squeeze(out, 0)
feature = out[0].numpy()

plt.plot(feature)
plt.show()