Is there anyone who can give me some idea how i can plot a loss landscape like below in pytorch?
Is there anyone who can give me some idea how i can plot a loss landscape like below in pytorch?
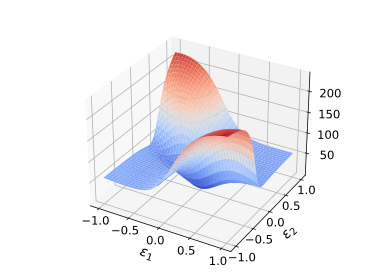
This type of plot is a surface plot and you could use matplotlib for it. I don’t know what the current recommended technique is to create this loss surface from a DL model, but e.g. this paper might be useful.
Looking for the same thing here, have you managed to find any solutions yet? Thanks!
import torch
import numpy as np
import matplotlib.pyplot as plt
from mpl_toolkits.mplot3d import Axes3D
import wandb
import io

def plot_loss_landscape(model, loss_fn, dataloader, num_points=20, alpha=1.0):
    # Store original parameters
    original_params = [p.clone() for p in model.parameters()]

    # Calculate two random directions
    direction1 = [torch.randn_like(p) for p in model.parameters()]
    direction2 = [torch.randn_like(p) for p in model.parameters()]

    # Normalize directions
    norm1 = torch.sqrt(sum(torch.sum(d**2) for d in direction1))
    norm2 = torch.sqrt(sum(torch.sum(d**2) for d in direction2))
    direction1 = [d / norm1 for d in direction1]
    direction2 = [d / norm2 for d in direction2]

    # Create grid
    x = np.linspace(-alpha, alpha, num_points)
    y = np.linspace(-alpha, alpha, num_points)
    X, Y = np.meshgrid(x, y)

    # Calculate loss for each point
    Z = np.zeros_like(X)
    for i in range(num_points):
        for j in range(num_points):
            # Update model parameters
            for p, d1, d2 in zip(model.parameters(), direction1, direction2):
                p.data = p.data + X[i,j] * d1 + Y[i,j] * d2

            # Calculate loss
            total_loss = 0
            num_batches = 0
            for batch in dataloader:
                inputs, targets = batch
                outputs = model(inputs)
                loss = loss_fn(outputs, targets)
                total_loss += loss.item()
                num_batches += 1
            Z[i,j] = total_loss / num_batches

            # Reset model parameters
            for p, orig_p in zip(model.parameters(), original_params):
                p.data = orig_p.clone()

    # Plot the loss landscape
    fig = plt.figure(figsize=(10, 8))
    ax = fig.add_subplot(111, projection='3d')
    surf = ax.plot_surface(X, Y, Z, cmap='viridis')
    ax.set_xlabel('Direction 1')
    ax.set_ylabel('Direction 2')
    ax.set_zlabel('Loss')
    ax.set_title('Loss Landscape')
    fig.colorbar(surf)

    # Save the plot to a buffer
    buf = io.BytesIO()
    plt.savefig(buf, format='png')
    buf.seek(0)

    # Close the plot to free up memory
    plt.close(fig)

    return buf

def log_loss_landscape(model, loss_fn, dataloader, step):
    # Generate the loss landscape plot
    buf = plot_loss_landscape(model, loss_fn, dataloader)

    # Log the plot to wandb
    wandb.log({
        "loss_landscape": wandb.Image(buf, caption="Loss Landscape"),
        "step": step
    })