Hello mates, sorry for creating this issue here ( because this community is better than stackoverflow)
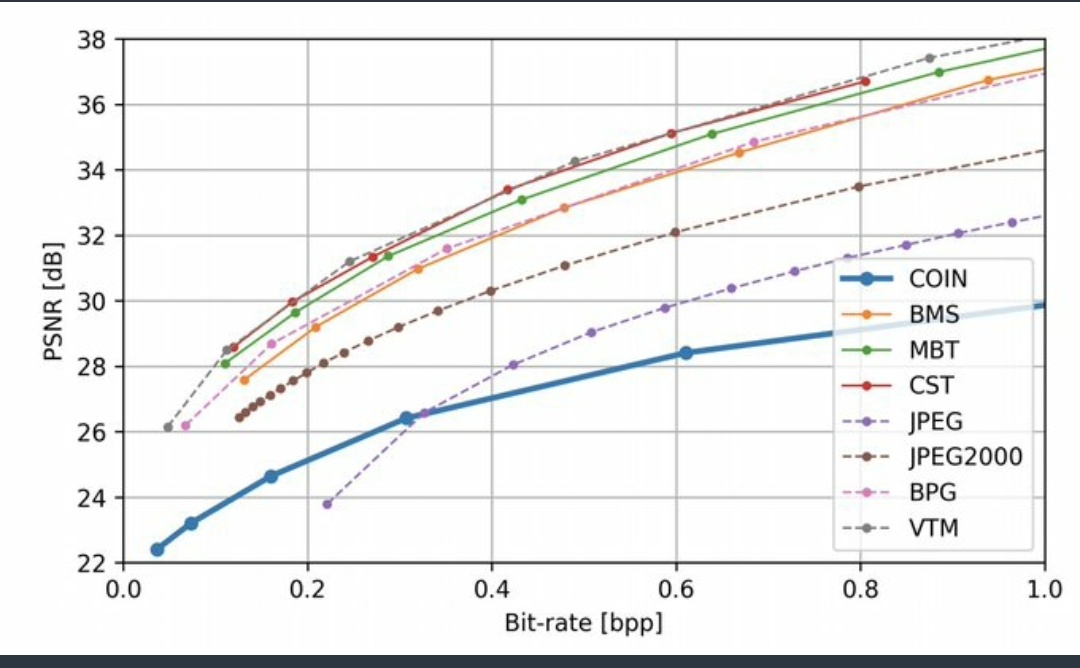
So I want to plot the psnr Vs Bitrate graph of an image which is used in compression papers, etc…
If there is any available code in python or matlab that would be helpful or may be some explanation which help to go throw the algorithm.
Thanks