Easy way to plot train and val accuracy
train loss and val loss graph.
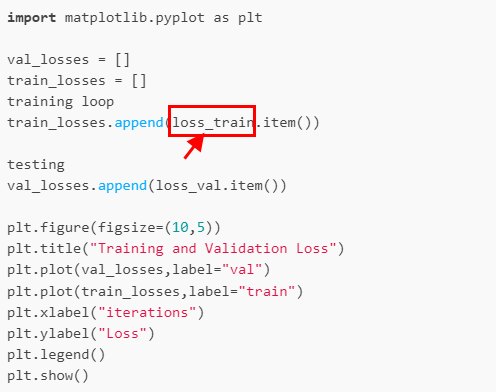
One simple way to plot your losses after the training would be using matplotlib:
import matplotlib.pyplot as plt

val_losses = []
train_losses = []
training loop
train_losses.append(loss_train.item())

testing
val_losses.append(loss_val.item())

plt.figure(figsize=(10,5))
plt.title("Training and Validation Loss")
plt.plot(val_losses,label="val")
plt.plot(train_losses,label="train")
plt.xlabel("iterations")
plt.ylabel("Loss")
plt.legend()
plt.show()
The more elegant way, which lets you check your progress during training as well is tensorboard:
from torch.utils.tensorboard import SummaryWriter

# Writer will output to ./runs/ directory by default
writer = SummaryWriter(logdir)

training loop
train_loss += loss_train.item()
writer.add_scalar('Loss/train', training_loss, global_step)

testing
val_loss += loss_val.item()
writer.add_scalar('Loss/val', val_loss, global_step)

writer.close()
Accuracy works the same
thank u for your reply
train_loss.append(train_loss)
valid_loss.append(test_loss)

train_acc.append(train_acc)

valid_acc.append(test_acc)
train_loss = np.array(train_loss)
valid_loss = np.array(valid_loss)
train_acc = np.array(train_acc)
valid_acc = np.array(valid_acc)
data =np.array([train_loss, train_acc,valid_acc,valid_loss])
np.savetxt(‘path’, data, fmt=’%.9f’)//if u wanna plot all
#plot…
fig = plt.figure()
plt.subplot(111)
plt.plot(np.arange(1,EPOCH+1),train_acc)
plt.plot(np.arange(1,EPOCH+1),valid_acc)
plt.title(“Accuray”)
plt.xlabel(“Epochs”)
plt.ylabel(“Acc”)
plt.legend([“Train Acc”,“Test Acc”],loc = “lower right”)
plt.savefig("./CNN_accuracy.png",dpi = 600)
fig = plt.figure()
plt.subplot(111)
plt.plot(np.arange(1,EPOCH+1),train_loss)
plt.plot(np.arange(1,EPOCH+1),valid_loss)
plt.title(“Losss”)
plt.xlabel(“Epochs”)
plt.ylabel(“Acc”)
plt.legend([‘train loss’, ‘valid loss’], loc=“upper right”)
plt.savefig("./loss.png",dpi = 600)`*[quote=“Mercy, post:4, topic:105524, full:true”]
train_loss.append(train_loss)
valid_loss.append(test_loss)

train_acc.append(train_acc)

valid_acc.append(test_acc)
train_loss = np.array(train_loss)
valid_loss = np.array(valid_loss)
train_acc = np.array(train_acc)
valid_acc = np.array(valid_acc)
data =np.array([train_loss, train_acc,valid_acc,valid_loss])
np.savetxt(‘path’, data, fmt=’%.9f’)//if u wanna plot all
#plot…
fig = plt.figure()
plt.subplot(111)
plt.plot(np.arange(1,EPOCH+1),train_acc)
plt.plot(np.arange(1,EPOCH+1),valid_acc)
plt.title(“Accuray”)
plt.xlabel(“Epochs”)
plt.ylabel(“Acc”)
plt.legend([“Train Acc”,“Test Acc”],loc = “lower right”)
plt.savefig("./CNN_accuracy.png",dpi = 600)
fig = plt.figure()
plt.subplot(111)
plt.plot(np.arange(1,EPOCH+1),train_loss)
plt.plot(np.arange(1,EPOCH+1),valid_loss)
plt.title(“Losss”)
plt.xlabel(“Epochs”)
plt.ylabel(“Acc”)
plt.legend([‘train loss’, ‘valid loss’], loc=“upper right”)
plt.savefig("./loss.png",dpi = 600)
[/quote]
[quote=“Mercy, post:4, topic:105524, full:true”]
train_loss.append(train_loss)
valid_loss.append(test_loss)

train_acc.append(train_acc)

valid_acc.append(test_acc)
train_loss = np.array(train_loss)
valid_loss = np.array(valid_loss)
train_acc = np.array(train_acc)
valid_acc = np.array(valid_acc)
data =np.array([train_loss, train_acc,valid_acc,valid_loss])
np.savetxt(‘path’, data, fmt=’%.9f’)//if u wanna plot all
#plot…
fig = plt.figure()
plt.subplot(111)
plt.plot(np.arange(1,EPOCH+1),train_acc)
plt.plot(np.arange(1,EPOCH+1),valid_acc)
plt.title(“Accuray”)
plt.xlabel(“Epochs”)
plt.ylabel(“Acc”)
plt.legend([“Train Acc”,“Test Acc”],loc = “lower right”)
plt.savefig("./CNN_accuracy.png",dpi = 600)
fig = plt.figure()
plt.subplot(111)
plt.plot(np.arange(1,EPOCH+1),train_loss)
plt.plot(np.arange(1,EPOCH+1),valid_loss)
plt.title(“Losss”)
plt.xlabel(“Epochs”)
plt.ylabel(“Acc”)
plt.legend([‘train loss’, ‘valid loss’], loc=“upper right”)
plt.savefig("./loss.png",dpi = 600)
What is loss_train ?
Are you asking why the name (1) or what loss is (2)?
- (1) Your normal loss during training as opposed to your loss during validation.
- (2) Neural Networks use a loss function as an objective function. The goal during training of a Neural Network is the minimization of the loss functions output, called loss.
From where is this variable?
That’s the current output from your loss function.
The original question was how loss and accuracy can be plotted on a graph.
So the answer just shows losses being added up and plotted.
The above code excludes your training loop, it would go where it says training loop.
Let me add an example training loop. Maybe that clears up the confusion.
import matplotlib.pyplot as plt

val_losses = []
train_losses = []
for epoch in range(epochs):
        for i, data in enumerate(trainloader, 0):
                inputs, labels = data
                optimizer.zero_grad()
                outputs = net(inputs)
                loss = loss_function(outputs, labels)
                loss.backward()
                optimizer.step()
                train_losses.append(loss_train.item())

#testing loop goes here
val_losses.append(loss_val.item())

plt.figure(figsize=(10,5))
plt.title("Training and Validation Loss")
plt.plot(val_losses,label="val")
plt.plot(train_losses,label="train")
plt.xlabel("iterations")
plt.ylabel("Loss")
plt.legend()
plt.show()
Okay, thank you, understand.