How to plot training and testing graphs for this pytorch model here?

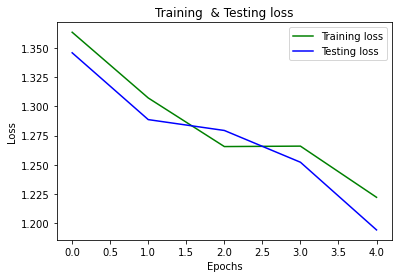
Hi there I am training a model for the function train and test given here, finally called the main function. I need to see the training and testing graphs as per the epochs for observing the model performance. Can someone extend the code here?

import torch
from torch.utils.data import DataLoader as DL
from torch import nn, optim

import numpy as np
import matplotlib.pyplot as plt
from sklearn.metrics import accuracy_score
from torch.utils.data import DataLoader
from SpeechDataGenerator import SpeechDataGenerator
from models.Emo_Raw_TDNN_StatPool import Emo_Raw_TDNN
import fit_predict as fp
from utils import utils_wav

from sklearn.metrics import confusion_matrix
from utils.utils_wav import speech_collate


torch.manual_seed(0)
torch.cuda.manual_seed(0)


def breaker():
    print("\n" + 50*"-" + "\n")


tr_info_file = "meta/training.txt"
ts_info_file = "meta/testing.txt"

tr_batch_size = 16
ts_batch_size = 16
device = torch.device("cuda" if torch.cuda.is_available() else "cpu")

epochs = 100

if __name__ == "__main__":

    tr_audio_links = [line.rstrip('\n').split(' ')[0] for line in open(tr_info_file)]
    ts_audio_links = [line.rstrip('\n').split(' ')[0] for line in open(ts_info_file)]


    tr_raw = []
    for i in range(len(tr_audio_links)):
        tr_raw.append(utils_wav.load_data_wav(tr_audio_links[i]))
    tr_raw = np.array(tr_raw)

    ts_raw = []
    for i in range(len(ts_audio_links)):
        ts_raw.append(utils_wav.load_data_wav(ts_audio_links[i]))
    ts_raw = np.array(ts_raw)


    dataset_train = SpeechDataGenerator(manifest='meta/training.txt',mode='train')
    dataloader_train = DataLoader(dataset_train, batch_size=tr_batch_size ,shuffle=True,collate_fn=speech_collate) 

    dataset_test = SpeechDataGenerator(manifest='meta/testing.txt',mode='test')
    dataloader_test = DataLoader(dataset_test, batch_size=ts_batch_size ,shuffle=False,collate_fn=speech_collate) 
   

    torch.manual_seed(0)
  
    model = TDNN(1, 4).to(device)
    optimizer = optim.Adam(model.parameters(), lr=0.0001, weight_decay=0.0, betas=(0.9, 0.98), eps=1e-9)
    loss_fun = nn.CrossEntropyLoss()
    from time import time
    import os

    start_time=time()
    def train(dataloader_train,epoch):
        train_loss_list=[]
        full_preds=[]
        full_gts=[]
        model.train()
        est=time()
        for i_batch, sample_batched in enumerate(dataloader_train):
            
            features = torch.from_numpy(np.asarray([torch_tensor.numpy() for torch_tensor in sample_batched[0]])).float()
            labels = torch.from_numpy(np.asarray([torch_tensor[0].numpy() for torch_tensor in sample_batched[1]])).long()
            features, labels = features.to(device),labels.to(device)
            features.requires_grad = True
            optimizer.zero_grad()
            pred_logits = model(features)
            #### CE loss
            loss = loss_fun(pred_logits,labels)
            loss.backward()
            optimizer.step()
            train_loss_list.append(loss.item())
            #train_acc_list.append(accuracy)
            if i_batch%100==0:
                print('Loss {} after {} iteration'.format(np.mean(np.asarray(train_loss_list)),i_batch))
            
            predictions = np.argmax(pred_logits.detach().cpu().numpy(),axis=1)
            for pred in predictions:
                full_preds.append(pred)
            for lab in labels.detach().cpu().numpy():
                full_gts.append(lab)
                
        mean_acc = accuracy_score(full_gts,full_preds)
        mean_loss = np.mean(np.asarray(train_loss_list))
       
    
        print('Total training loss {} and training Accuracy {} after {} epochs'.format(mean_loss,mean_acc,epoch))
        print('Time Taken for Epoch: {:.2f} minutes'.format((time() - est)/60))
    
    
    def test(dataloader_test,epoch):
        model.eval()
        with torch.no_grad():
            val_loss_list=[]
            full_preds=[]
            full_gts=[]
            for i_batch, sample_batched in enumerate(dataloader_test):
                features = torch.from_numpy(np.asarray([torch_tensor.numpy() for torch_tensor in sample_batched[0]])).float()
                labels = torch.from_numpy(np.asarray([torch_tensor[0].numpy() for torch_tensor in sample_batched[1]])).long()
                features, labels = features.to(device),labels.to(device)
                pred_logits = model(features)
                #### CE loss
                loss = loss_fun(pred_logits,labels)
                val_loss_list.append(loss.item())
                #train_acc_list.append(accuracy)
                predictions = np.argmax(pred_logits.detach().cpu().numpy(),axis=1)
                for pred in predictions:
                    full_preds.append(pred)
                for lab in labels.detach().cpu().numpy():
                    full_gts.append(lab)
                    
            mean_acc = accuracy_score(full_gts,full_preds)
            mean_loss = np.mean(np.asarray(val_loss_list))
           
    
            print('Total Test loss {} and Test accuracy {} after {} epochs'.format(mean_loss,mean_acc,epoch))
            
            model_save_path = os.path.join('save_model', 'best_check_point_'+str(epoch)+'_'+str(mean_acc))
            state_dict = {'model': model.state_dict(),'optimizer': optimizer.state_dict(),'epoch': epoch}
            torch.save(state_dict, model_save_path)
            
if __name__ == '__main__':
    for epoch in range(epochs):
        train(dataloader_train,epoch)
        test(dataloader_test,epoch)
   '''

please guide 
I know the first need is to save the model accuracies and loss, for this model need to save But how to plot this using skelearn or any other way that I need to know here.
Thanks

Look into tensorboard

@ZimoNitrome Thanks
I saw this link, did all code change in my training and testing for plotting training and testing loss and ACC by instantiating to SummaryWriter(), But after successfully installing tensorboard by command
!pip install tensorboard

When I run
tensorboard --logdir runs
It throw error as

invalid syntax
Also tried
tensorboard --logdir=runs
Then the error is

cannot assign to operator
Please guide what to do.

@ptrblck Hi sir, sorry for this tag :slight_smile:
But I think you are the life saver here. I am using tensorboard for graph plots to see my training and testing acc and loss progress. Due to limited GPU support on my laptop I am now using colab for same. Sir I can see the runs folder there. But when I call

!tensorboard --logdir=runs
and then opening this link says

# No dashboards are active for current data set

sir, please help. I have to use these plots in my writing.

You could check if the folder contains some Tensorboard-related files and if so maybe refresh Tensorboard itself.
Personally, I haven’t used Tensorboard much as I was always running into similar trouble of displaying the data “live” (I must admit that I’ve tried it a few years ago so things might have changed/improved by now).
Back then I’ve stuck to visdom, which didn’t support all the features of Tensorboard but was a better fit for my use cases (more flexibility to display plots and they were shown immediately).
I’m not sure if you need to use Tensorboard or if displaying the curves via matplotlib in your notebook would also work.

yes, sir @ptrblck I just wanted to see the training plots for loss and accuracy of my model.
Are there any used examples for visdom?

It is straight and simple in tensorboard but I don’t know why is it not working in colab, though I can see the runs folder made using the writer(). I cant find any forum or resource to discuss the issue either.

visdom provides some examples but I don’t know what the current status of its development is and haven’t used it in a while.

An easy way to plot your loss curves would be to just use matplotlib in the notebook as mentioned before.

Sir @ptrblck I am using the code mentioned above. I don’t know know how to save these scaler values ```
mean_acc and mean_loss in training and testing. and finally, plot them in two plots one for loss and the other for accuracy.

Hi @hema_rathore have you done the plotting also? I mean did you get these plots there?

@ptrblck yes sir, I tried matplotlib

plt.plot(epochs, mean_loss, 'g', label='Training loss')
plt.plot(epochs, mean_acc, 'b', label='Training  acc')
plt.title('Training  loss and acc')
plt.xlabel('Epochs')
plt.ylabel('Loss and acc')
plt.legend()
plt.show()

but in my code (in initial question dont know how to use it) as above code in train and test function can plot loss and acc for training and testing. But I want to plot loss for train and test in a single plot and similarly acc for train and test.
Regards

You can try wandb instead of tensorboard

1 Like

You could return the tensors or numpy arrays containing the loss values from the train and test functions and plot it in a single plt.plot in the main script.

Sir I did that. Using this code out of main unction.

plt.plot(Loss_train, 'g', label='Training loss')
plt.plot(Loss_test, 'b', label='Testing loss')
plt.title('Training  & Testing loss')
plt.xlabel('Epochs')
plt.ylabel('Loss')
plt.legend()
plt.show()

plt.plot(Acc_train, 'g', label='Training  acc')
plt.plot(Acc_test, 'b', label='Testing  acc')
plt.title('Training  & Testing acc')
plt.xlabel('Epochs')
plt.ylabel('Acc')
plt.legend()
plt.show()

I have saved the tensors Acc_train, Acc_test, Loss_train and Loss_test. The only confusion is, here the epochs are plotted automatically on x -axis? As I am not giving epoch here. Result for 5 epochs is plotted as below

image

Yes, if you don’t pass an x array but only the y array to plot the x-axis will be set as np.arange(len(y)). Refer to the matplotlib docs for more information.

Hey Krishna! I work for Weights & Biases and the problem you’re trying to solve with experiment tracking seems like the perfect use-case for the product. Basically, you pass one line of code wandb.watch(model, log_freq=100) (wandb is the name of the Python client) and all your training metrics/test metrics, as well, as CPU/GPU usage all get pulled into a single dashboard where you can compare them side-by-side with interactive charts. Beyond that, W&B also tracks your different models’ hyperparameters, so you don’t have to worry about keeping track of them also. Basically, it’s just a lot more convenient than using matplotlib to track training metrics.

Here are the W&B PyTorch docs you can use to get started and do let me know if I you have any questions.