Here is the output from torch.jit.trace on one of my model.
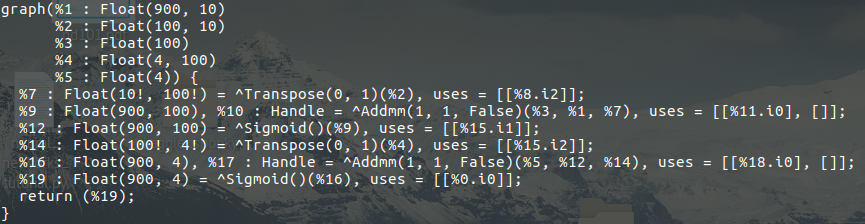
Most of these are intuitive but I couldn’t understand the meaning of certain keywords. Do we have a good documentation for explaining what is in there? If not, could somebody help me understand what does “Handle” and “uses” in this line mean?
%9 : Float(900, 100), %10 : Handle = ^Addmm(1, 1, False)(%3, %1, %7), uses = [[%11.i0], []];