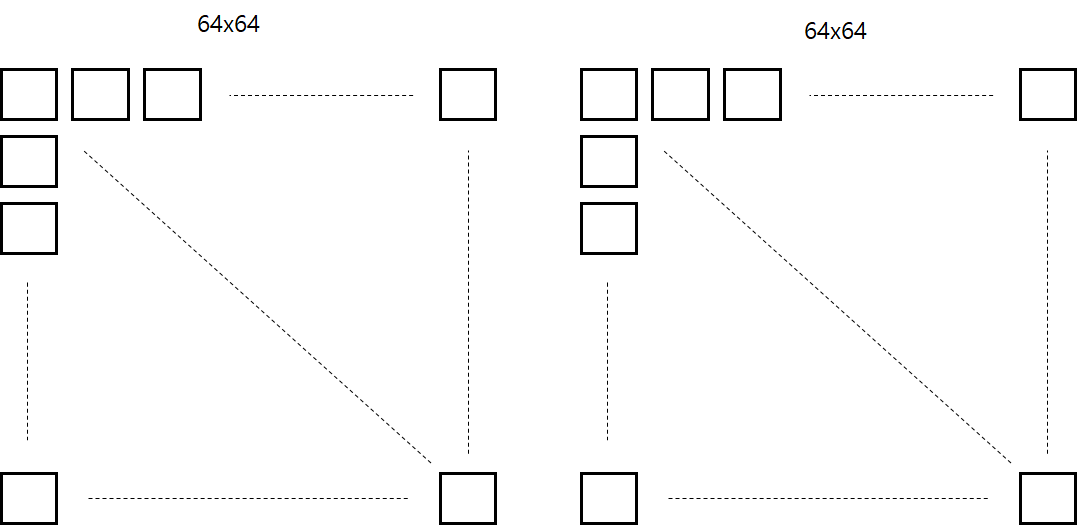
I can make one 64x64 figure using subplot
but can’t make two figure in one like upper image…
How can I do this in one figure?
And this is my fool code
def visfeaturemap(feature_maps, filename='default.png', save=False):
    # plot all 64 maps in an 8x8 squares
    square = 8
    ix = 1
    for _ in range(square):
        for _ in range(square):
            # specify subplot and turn of axis
            ax = plt.subplot(square, square, ix)
            ax.set_xticks([])
            ax.set_yticks([])
            # plot filter channel in grayscale
            plt.title(filename)
            plt.imshow(feature_maps[0, ix - 1, :, :].cpu().numpy())
            ix += 1

    plt.title(filename)
    plt.show()

    if save:
        plt.savefig(filename)
Otherwise, this modified version of your code should do the work :
def visfeaturemap(feature_maps, filename='default.png', save=False):
    # plot all 128 maps in two 8x8 squares
    square = 8
    for ix in range(square):
        for jx in range(square):
            # plot features_0 on the left
            # specify subplot and turn off axis
            ax = plt.subplot(square, 1+2*square, 1 + jx + (1+2*square)*ix)
            ax.set_xticks([])
            ax.set_yticks([])
            # plot filter channel in grayscale
            plt.imshow(feature_maps[0, ix].cpu().numpy())

            # plot features_1 on the right
            # specify subplot and turn off axis
            ax = plt.subplot(square, 1+2*square, 1 + jx + (1+2*square)*ix + (1+square))
            ax.set_xticks([])
            ax.set_yticks([])
            # plot filter channel in grayscale
            plt.imshow(feature_maps[1, ix].cpu().numpy())

    plt.title(filename)
    plt.show()

    if save:
        plt.savefig(filename)
matplotlib.pyplot.subplots_adjust could probably be used.
Note that you would get faster and better answers on e.g. StackOverflow for non-PyTorch-specific questions.