I wanna trace all related kernels when making DL inference in pytorch and store kernel information locally for other purposes. Unfortunately, I cannot find where I could get this in source code. In other words, where pytorch launch kernels when DL inference. Could you give me some suggestions?
Thanks so much !
God bless you
I’m not sure which “kernel information” you would like to store, but would profiling the workload work as described here?
There is not a single place where the kernels are launched and you would need to check which operations are used. E.g. a lot of kernels are launched in files stored in aten/src/ATen/, but I also don’t fully understand your use case and why you are looking for the locations of all kernel launches.
When I profiled vgg11 model inference with batchsize 1 , using Nsight System, I found that there are 45 kernels executed in total . I wanna trace all these kernels and re-organize them into a graph or stream besides some academic purpose. So how can I get that
I still don’t know what exactly you want to read in the end, but since you are already using Nsight you might want to add the --trace option and try to process the profile created by Nsight Systems, as it would show the callstack for each kernel.
actually, I wanna implement cuda-graph in C++ level manually rather than depending on Pytorch
Unsure why you are not using the built-in CUDA Graphs util. as it sounds quite challenging, but I’m sure you have valid reasons for it. Good luck and let me know how it goes!
I do not know how to collect kernels using pytorch API…
I am reading pytorch source code related to CUDA graph. I am confused why torch devs designs cuda generator in struct CUDAGraph in file CUDAGraph.h How can I use it
You can use CUDA Graphs in PyTorch as described here. I don’t know what exactly is confusing about the file naming.
Hi @ptrblck sorry for reviving an old topic.
But, I also needed some help in getting the exact number of kernel launches that CUDA does for a given DNN training . I needed this for academic research, where we are trying to model the interference of 2 models as the number of kernel launches happening per layer on Nvidia Jetsons.
I have the following specific questions :
-
Is there a flag or env variable that I can supply to pytorch at compile time in order to get info on how many kernels are launched for a DNN training ?
-
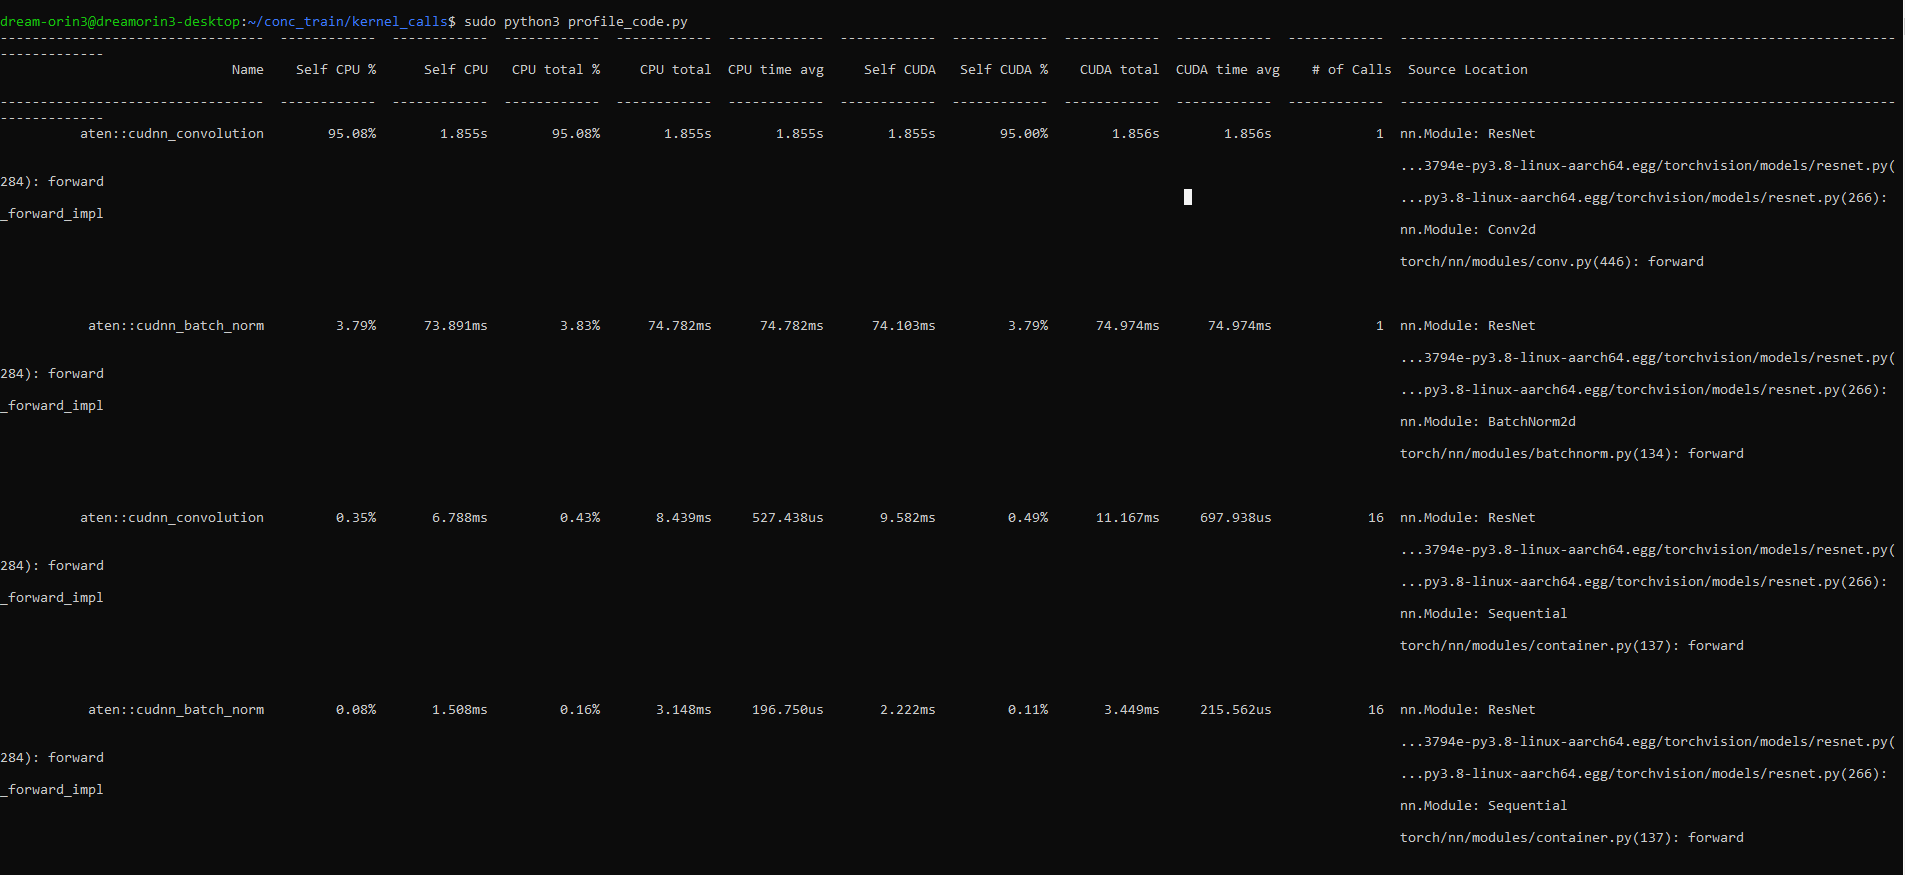
I used pytorch profiler and was able to get the #of calls done for each operation. AFAIK, operators like
aten::convolutionoraten::addmmgo as the input totorch_dispatch. Just wanted to confirm if these are also the names of kernels being called? If not, how can I get the actual kernel names and the # of times that kernel was invoked using Pytorch’s profiler ?
Thanks for your guidance!
You could use a CUDA profiler such as Nsight Systems, which will show all CUDA kernel launches.
1 Like