How to track/trace the cause of ever increasing GPU usage?

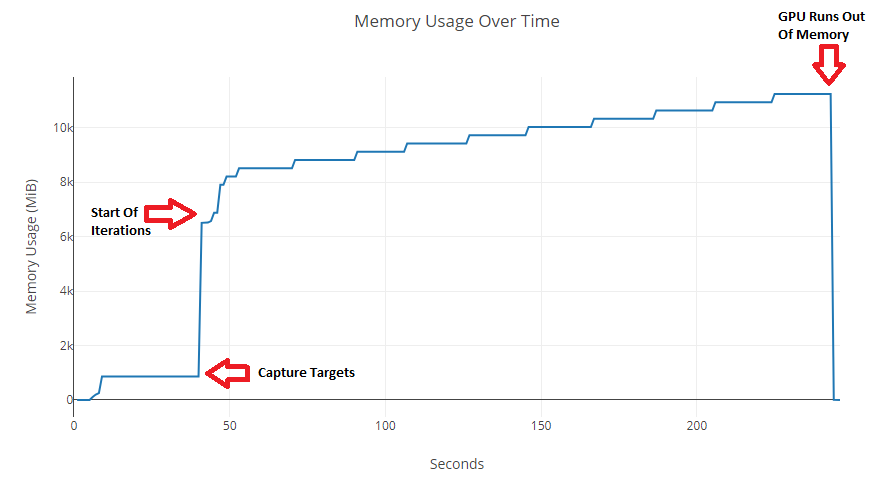
This is a graph of the GPU usage over time that when I run my code:

I’ve tried using del on Variables that I thought were causing the issue, but that didn’t seem to help. I also tried using gc.collect(), but that did nothing as well.

This function is where my iterations occur:

def closure()
             optimizer.zero_grad()
             net(img)
             loss = 0

             for mod in content_losses:
                 loss += mod.loss
             for mod in style_losses:
                 loss += mod.loss

             loss.backward(retain_graph=True)     
    
             #Save image function
             #Print loss values function
      return loss
optimizer.step(closure)

The optimizer is:

optimizer = optim.LBFGS([img], max_iter = 200, tolerance_change = -1, tolerance_grad = -1)

I can’t seem to figure out what is causing the memory usage to increase about every 10 iterations. Are there any easy to use tools that would allow me to discover the Variable(s) and/or line(s) of code which are responsible for this ever increasing GPU usage?

My strategy is to run individual operations in a for loop and watch the memory usage like this. No, I don’t know of any tools that do this.

My guess without seeing the rest of the code is be that you are retaining loss, which in turn retains the whole history at every iteration in memory.

If you need to keep a record of loss, just make sure you’re just storing its value (on 0.4, loss.item() or float(loss); on 0.3 loss.data) rather than the whole computation graph attached to it.

Maybe it’s unrelated, hope this helps anyway

I tried using:

import gc
for obj in gc.get_objects():
       if torch.is_tensor(obj) or (hasattr(obj, 'data') and torch.is_tensor(obj.data)):
            print(type(obj), obj.size())

After inspecting the resulting output, I see that two variables are increasing in their number over iterations:

Iterations 1-2:

0 mentions of: (<class 'torch.Tensor'>, (3723264,))

7 mentions of (<class 'torch.Tensor'>, ())

Iterations 2-3:

3 mentions of (<class 'torch.Tensor'>, (3723264,))

11 mentions of (<class 'torch.Tensor'>, ())

Iterations 4-5:

8 mentions of (<class 'torch.Tensor'>, (3723264,))

17 mentions of (<class 'torch.Tensor'>, ())

Iterations 34-35:

64 mentions of: (<class 'torch.Tensor'>, (3723264,))

77 mentions of: (<class 'torch.Tensor'>, ())

Iterations 35-36:

70 mentions of (<class 'torch.Tensor'>, (3723264,))

79 mentions of (<class 'torch.Tensor'>, ())

Iterations 47-48:

94 mentions of (<class 'torch.Tensor'>, (3723264,))

103 mentions of (<class 'torch.Tensor'>, ())

Iterations 96-97:

192 mentions of: (<class 'torch.Tensor'>, (3723264,))

201 mentions of: (<class 'torch.Tensor'>, ())

I’m not entirely sure what I happening, but I suspect this might be the cause of my issue. I wish I could see exactly which Variables are responsible for (<class 'torch.Tensor'>, (3723264,)), and (<class 'torch.Tensor'>, ()).

Removing my print and save functions do nothing to stop the issue.

Only adding 1 (of one of my loss modules) to my network, instead of 6, resulted in this:

Iterations 47-48:

92 mentions of: (<class 'torch.Tensor'>, (3723264,))
97 mentions of: (<class 'torch.Tensor'>, ())

Iterations 96-97:

190 mentions of: (<class 'torch.Tensor'>, (3723264,))
195 mentions of: (<class 'torch.Tensor'>, ())

These results just confuse me even more.

This line is creating the empty tensors:

             for mod in module_losses:

modules_losses is is a list of modules that I add to my network, so that I can call them in the closure function:

loss_module = ModuleLoss(strength)
net.add_module(str(len(net)), loss_module)
module_losses.append(loss_module)

And apparently doing this creates another empty tensor:

loss +=mod.loss

The empty and repeating tensors seem to be from L-BFGS. Adam doesn’t do this.

Using:

torch.backends.cudnn.benchmark = True

Seems to slow down the creation of these “repeating” tensors.

Specifying a history_size, seems to place a hard limit on the creation of these “repeating” tensors. Is this normal/expected behavior?

Hi! How do you plot your GPU usage like this? Is it a real-time update?