How to try/catch errors during training

Hi there!

The situation is as follows. I have a pytorch training loop with roughly the following structure:

optimizer = get_opt()
train_data_loader = Dataloader()
net = get_model()
for epoch in range(epochs):
    for batch in train_data_loader:
        output = net(batch)
        output["loss"].backward()
        optimizer.step()
        optimizer.zero_grad()

My dataset contains images and is very large (in number of items) and takes about half a day per epoch. Now some samples in my dataset can be of bad quality.
I want my training loop therefore to catch errors that incur during the forward pass, log them, and continue training, instead of interrupting the whole program because of some bad data element. This is what I had in mind:

optimizer = get_opt()
train_data_loader = Dataloader()
net = get_model()
for epoch in range(epochs):
    for batch in train_data_loader:
        try:
            output = net(batch)
        except Exception as e:
             logging.error(e, exc_info=True)  # log stack trace
             continue
        output["loss"].backward()
        optimizer.step()
        optimizer.zero_grad()

This way, if a forward pass fails, it will just get the next batch and not interrupt training. This works great for the validation loop, but during training I run into problems: GPU memory will not be released after the try/catch, and so I run into an OOM when pytorch tries to put the next batch on the GPU.
Things I’ve tried: after an error is catched (i.e. within the except):

  • move every parameter in net.parameters() to cpu, and/or detach them
  • delete every parameter in net.parameters()
  • run torch.cuda.empty_cache()
  • manually run gc.collect() (python garbage collection)
  • manually set all gradients of every parameter in net.parameters() to None

None of these methods made any difference. Is there a way to do this? I suspect its the gradients/ graph not being cleared, as this problem does not happen during validation (e.g. within a with torch.no_grad() context).
Hi,

I think it is a “known” issue with python exceptions. See Exception leaks in Python 2 and 3 | Kristján's Cosmic Percolator
In your case, since the differentiable output is in the current frame, it is kept alive by the exception as so holds on to the GPU memory forever since you never exit the function.

I think a simple fix for you would be to move the content of the loop in a separate function that will be exited at every iteration (clearing the exception properly).

Thanks for the information! I learned quite a bit from that blog post, so thanks for that.
The issue is however still not resolved. I’ve tried:

  • putting the try except in a dedicated function
def try_catch_forward(batch, net, optimizer):
   try:
       output = net(batch)
       loss = output["loss"]
       loss.backward()
       optimizer.step()
       optimizer.zero_grad()
   except Exception as e:
       logger.error(e, exc_info=True)
       loss = np.zeros((1))
   gc.collect()
   torch.cuda.empty_cache()
   return loss
  • manually clearing exception traceback with e.__traceback__= None (in the dedicated function)
  • doing traceback.clear_frames(e.__traceback__)
  • not logging the exception at all
  • gc.collect() and torch.cuda.empty_cache() inside the dedicated try/catch function.

None worked, unfortunately.

Note that the empty_cache() is not really needed as if you are about to run out of memory, it will be called automatically. And calling it too much is going to slow down your code quite a bit.

How do you measure if the issue is “resolved” or not?
Is there a small code sample (30-40 lines) you could share to see if we can reproduce it?

I set up the most basic network and data loader to reproduce the problem (74 lines sorry)

import torch
from torch import nn
import logging

logger = logging.getLogger(__name__)
logging.basicConfig()
logger.setLevel(logging.INFO)
NUM_CLASSES = 10


class Net(nn.Module):
    def __init__(self,):
        super(Net, self).__init__()
        self.network = torch.hub.load(
            "rwightman/pytorch-image-models",
            "efficientnet_b0",
            pretrained=True,
            features_only=True,
            in_chans=3,
        )
        mid_ch = self.network.feature_info[-1]["num_chs"]
        self.classifier = nn.Conv2d(mid_ch, NUM_CLASSES, kernel_size=1)
        self.criterion = nn.CrossEntropyLoss()

    def forward(self, batch):
        batch["image"] = batch["image"].float().cuda()
        batch["gt"] = batch["gt"].cuda()
        x = self.network(batch["image"])[-1]
        out_size = batch["gt"].size()[-2:]
        logits = self.classifier(x)
        logits = nn.functional.interpolate(
            logits,
            size=out_size,
            mode="bilinear",
            align_corners=False,
            recompute_scale_factor=False,
        )
        loss = self.criterion(target=batch["gt"].long().squeeze(1), input=logits)
        return {"loss": loss}


class Dataloader:
    def __init__(self, batch_size, size):
        self.batch_size = batch_size
        self.size = size

    def __iter__(self,):
        for i in range(250):
            img = torch.randn((self.batch_size, 3, self.size, self.size))
            target = torch.randint(NUM_CLASSES, (self.batch_size, 1, self.size, self.size))
            batch = {"image": img, "gt": target}
            yield batch


net = Net()
net.cuda()
optimizer = torch.optim.SGD(
    net.parameters(), lr=1e-2, weight_decay=5e-4, momentum=0.9, nesterov=False,
)
train_data_loader = Dataloader(batch_size=6, size=512)
logger.warning('starting training')
for i, batch in enumerate(train_data_loader):
    try:
        output = net(batch)
        if i % 50 == 0 and i != 0:
            raise ValueError
    except Exception as e:
        logging.error(e, exc_info=True)  # log stack trace
        continue
    logger.info(f'Loss: {output["loss"].item()} | iter: {i}')
    output["loss"].backward()
    optimizer.step()
    optimizer.zero_grad()

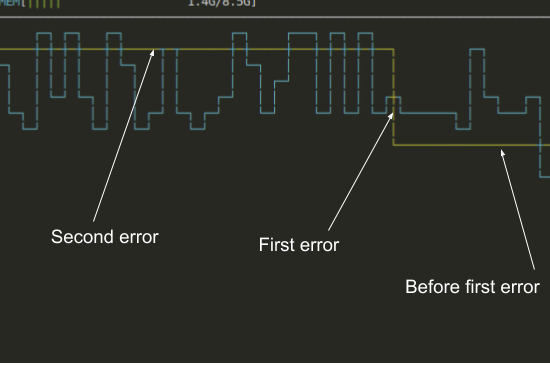
What is interesting is that the problem only occurs when the gpu memory consumption is well over 50% (for me that was at batch size 7 at minimum, with a 1070ti w/ ~8Gb memory), but the problem did not occur when using a batch size of 6 for instance. Here is a gpu consumption graph, before the first error, and after 2 errors when the problem does not occur, using a batch size of 6:

error
(yellow is gpu memory, blue gpu util)
So clearly some extra memory is allocated (to what I don’t know) due to the catched error, but it does not accumulate further beyond that, when another error occurs…
I have also verified that no gpu memory accumulates on catched errors when setting the whole loop in a with torch.no_grad() context, so it must have something to do with autograd right?

For me this issue is resolved in one of two ways:

  • I am shown a way that I can catch errors without gpu memory consumption building up (i.e. clearing the autograd graph somehow manually?)
  • or when this is simply not possible currently :man_shrugging: although I can’t imagine I’m the only one with this use case though, so then I’ll open a feature request in the pytorch repository.

Your code sample runs just fine on colab :confused:

Also the fact that the memory reported by the OS changed is expected. We use a special allocator that does not return the memory to the OS as soon as it is freed to improve speed.
So the bump here could be due to the change of allocation pattern after the error. But no further increase after that because the pattern remains the same.

Your code sample runs just fine on colab :confused:

Yeah no the sample runs depending on your gpu capabilities/ memory. I recommend scaling up the batch_size (in line train_data_loader = Dataloader(batch_size=6, size=512) to a higher one until you encounter the problem (so that the first 50 iterations run without problems but then a Cuda OOM is thrown for iter > 50)

Also the fact that the memory reported by the OS changed is expected. We use a special allocator that does not return the memory to the OS as soon as it is freed to improve speed.
So the bump here could be due to the change of allocation pattern after the error. But no further increase after that because the pattern remains the same.

So you’re saying that some extra memory is allocated to the autograd graph gradients that is never released? And cannot be released in any way?

Some extra memory is allocated during forward to be able to compute the backward yes.
This memory is released when all the references to it are dead (in general when your output/loss goes out of scope).
On top of that, the GPU memory is cached and is not returned to the OS even though it is available to allocate more Tensors within pytorch.

1 Like

So basically so solve this, I’d have to somehow get the latest “node” in the forward pass before the error occurred, compute a loss with that, and do loss.backward(); optimizer.zero_grad() to make its allocated memory available again for the next batch.

Or always keep half of my GPU memory available for potential “error space” :stuck_out_tongue:

On top of that, the GPU memory is cached and is not returned to the OS even though it is available to allocate more Tensors within pytorch.

Ah right.

No, you don’t have to, because even though it looks used when looking from the OS point of view, it is actually available to allocate more Tensors.
You can consider this a bad case scenario for the allocator that doesn’t realize you’re doing the same thing and so is caching more memory (even though it has a lot of available memory already).

Ah okay. So in short there is no way to do what I want to do; catch and log errors happening in the forward pass during model training, without interrupting training, and while fully utilizing the GPU memory. I.e. there is no way to avoid the extra GPU memory allocation that happens when an error is catched.

Is this something that could be fixed by posting an issue in the pytorch repository?

I am still not sure what the issue is here.
Nothing in PyTorch is holding onto that memory so there isn’t much we can do I think. It is most likely something in python when the exception is handled. So I would look more into that.
The extra memory use from the OS point of view is most likely a side effect of the caching alocator but the actual used memory is most likely the same.

I don’t think opening an issue would be very helpful if we don’t know where it comes from.

Hmm. The issue is that, if a forward pass is interrupted by an error, but the error is not raised, the following forward pass will require additional GPU memory, potentially causing an OOM (if the GPU memory is already almost fully used before the error happens).
In other words, there is no way nicely recover from an error incurred in the forward pass during training, which would be a nice feature.

So just to be clear, you are saying that additional GPU memory is allocated but not actually used?
Were you able to reproduce the problem using a higher batch size?

Thanks for your answers so far by the way, and sorry for my limited understanding

Not really.
See the modified code here that prints the actual used memory accros iterations:

import torch
from torch import nn
import logging

logger = logging.getLogger(__name__)
logging.basicConfig()
logger.setLevel(logging.INFO)
NUM_CLASSES = 10


class Net(nn.Module):
    def __init__(self,):
        super(Net, self).__init__()
        self.network = torch.hub.load(
            "rwightman/pytorch-image-models",
            "efficientnet_b0",
            pretrained=True,
            features_only=True,
            in_chans=3,
        )
        mid_ch = self.network.feature_info[-1]["num_chs"]
        self.classifier = nn.Conv2d(mid_ch, NUM_CLASSES, kernel_size=1)
        self.criterion = nn.CrossEntropyLoss()

    def forward(self, batch):
        batch["image"] = batch["image"].float().cuda()
        batch["gt"] = batch["gt"].cuda()
        x = self.network(batch["image"])[-1]
        out_size = batch["gt"].size()[-2:]
        logits = self.classifier(x)
        logits = nn.functional.interpolate(
            logits,
            size=out_size,
            mode="bilinear",
            align_corners=False,
            recompute_scale_factor=False,
        )
        loss = self.criterion(target=batch["gt"].long().squeeze(1), input=logits)
        return {"loss": loss}


class Dataloader:
    def __init__(self, batch_size, size):
        self.batch_size = batch_size
        self.size = size

    def __iter__(self,):
        for i in range(10):
            img = torch.randn((self.batch_size, 3, self.size, self.size))
            target = torch.randint(NUM_CLASSES, (self.batch_size, 1, self.size, self.size))
            batch = {"image": img, "gt": target}
            yield batch


net = Net()
net.cuda()
optimizer = torch.optim.SGD(
    net.parameters(), lr=1e-2, weight_decay=5e-4, momentum=0.9, nesterov=False,
)
train_data_loader = Dataloader(batch_size=10, size=40)
logger.warning('starting training')
for i, batch in enumerate(train_data_loader):
    print(torch.cuda.memory_allocated())
    try:
        output = net(batch)
        print(torch.cuda.memory_allocated())
        if i % 3 == 0 and i != 0:
            raise ValueError("Value error")
    except Exception as e:
        # logging.error(e, exc_info=True)  # log stack trace
        print('caugh an error, keep going ' + str(e))
        continue
    print(f'Loss: {output["loss"].item()} | iter: {i}')
    output["loss"].backward()
    optimizer.step()
    optimizer.zero_grad()

Which prints:

WARNING:__main__:starting training

14631936
51151872
Loss: 3.2388575077056885 | iter: 0
43490816
80133120
Loss: 3.1496763229370117 | iter: 1
43490816
80133120
Loss: 3.0223429203033447 | iter: 2
43490816
80133120
caugh an error, keep going Value error
80133120
80010240
Loss: 3.105882167816162 | iter: 4
43490816
80133120
Loss: 3.029092311859131 | iter: 5
43490816
80133120
caugh an error, keep going Value error
80133120
80010240
Loss: 2.8809430599212646 | iter: 7
43490816
80133120
Loss: 2.9971139430999756 | iter: 8
43490816
80133120
caugh an error, keep going Value error

Most iteration, the memory goes down because the call to backward frees the buffers.
When you skip that because of the error, the memory is not freed but that does not change the final usage.

Thanks for this. So the backward call frees the buffers for the next batch. As we skip the backward call this will raise the memory usage one iteration basically, leading to an OOM if no extra GPU space is available. Is there a way to manually clear those buffers without calling backward?
From your answer on this post, the only option I see is getting the last tensor in the graph before the error occurred (somehow) and deleting it (or calling backward on it and setting al gradients to zero).

Is there a way to manually clear those buffers without calling backward?

Yes you just need to make sure you don’t have any reference to this graph before looping.
You can either do a bunch of del statements. Or use a function so that you are sure that everything that was still in scope is deleted before looping.