Hi,
The grad function can be used to calculate partial derivative according to this post. As per documentation,
If
create_graph=True, graph of the derivative will be constructed, allowing to compute higher order derivative products.
and retain_graph will be automatically set to True. However, I’m a bit confused how it works, or in other words, what should the computation graph look like by using this option.
As a tractable example, let x be a known vector, f be a torch.nn.Module instance that returns a scalar, and θ be the parameters of f:
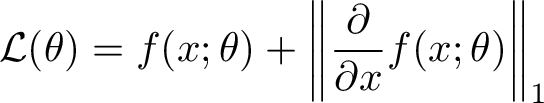
To implement this loss, which will be subsequently differentiated against θ, I think a good implementation should:
- not compute gradient with respect to θ when evaluating the partial gradient with respect to x
- have the two occurrences of x sharing the same data
- contain only one graph for f(x;θ)
- treat the partial derivative in the second term as a new function with respect to θ
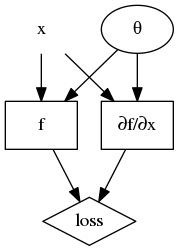
The computation graph I’d like to achieve should appear as: (legend: node without border → requires_grad=False; node in oval border → requires_grad=True; node in rectangle border → torch.nn.Module instance or similar entity in a computation graph; node in diamond border → the scalar output i.e. the loss)
To attain the desired computation graph I may write the following code (version: PyTorch-0.4.1):
# `x` is the input such that x.requires_grad is False;
# `f` is the network
# As a specific example, assume that:
# x = torch.rand(3)
# f = torch.nn.Linear(3, 1)
import torch
from torch.autograd import grad
# build graph for f(x;theta) without derivative
loss1 = f(x)
# only_inputs=True: so that gradient of f(x) with respect to theta is not evaluated here
# create_graph=True: so that `dfdx` can be used as intermediate node in other graph
# retain_graph=False: so that we won't have a duplicate graph for f(x)
x_ = x.detach().requires_grad_()
dfdx, = grad(f(x_), x_, only_inputs=True, create_graph=True, retain_graph=False)
loss2 = torch.norm(dfdx, 1)
loss = loss1 + loss2
loss.backward()
This code snippet certainly compiles. However, it’s quite difficult for me to directly verify the result is correct. My questions here are:
- How to visualize the computation graph created by
create_graph=Truein the above simple code? - Does
retain_graph=Falsedo what I intend to do as shown in comment? What if I change toretain_graph=True? - Is there a way to not compute
f(x)twice while maintaining the same computation graph?
Thanks for reading till here! Thanks in advance for your help!