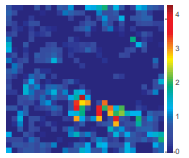
Hi, I have feature map in shape of [num_channels, height, weight], how can I visualize it and create picture like this:
You could use matplotlib.pyplot.imshow to visualize these tensors:
x = torch.randn(10, 100, 100)

f, axarr = plt.subplots(x.size(0))
for ax, x_ in zip(axarr, x):
    ax.imshow(x_.numpy())
Thanks a lot for your reply! But can I draw these 10 channels into 1 image rather than 10 images respectively? Besides, I want to save it as a ‘png’ file.
How would you like to visualize 10 channels in your image?
The usual image libraries work with a single channel image (grayscale) or 3 channel images (RGB).
Oh I got it. Sorry for my stupid question. Thank you again.
I don’t think it’s a stupid question and there might still be some “reasonable” mapping between 10 channels to 3 channels, but I’m not aware of any at the moment.