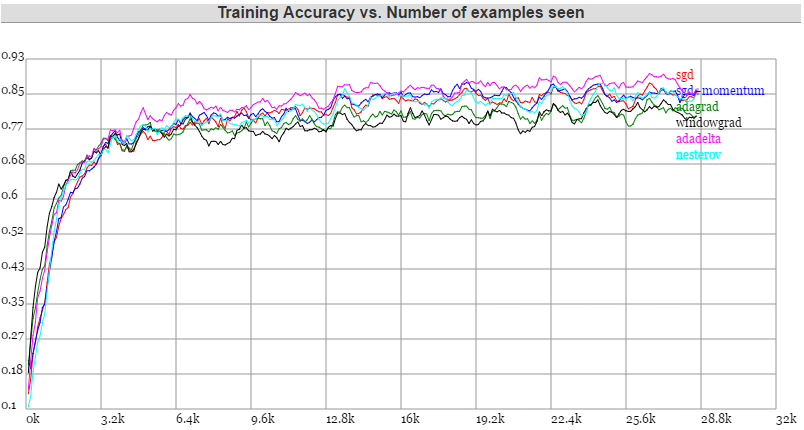
Hello, I’m trying to visualize the loss and accuracy for different models in every epoch!But I wanna know how to put them together in one window?As we all know, training the model can cost much time and GPU power, so it might be very diffcult to compare differect models at the same time? So do you just store the loss of different models in the same file. And after everything is done, just read data from the file and paint them using visdom ?
Wouldn’t it work if you use different window names in your scripts so that the corresponding windows will be updates on the fly?
Sorry, I misunderstood your use case.
In that case, you could just pass the window handle to your scripts (which is basically a string) and use it to plot to the same window:
viz = Visdom()

# line updates
win = viz.line(
    X=np.column_stack((np.arange(0, 10), np.arange(0, 10))),
    Y=np.column_stack((np.linspace(5, 10, 10),
                       np.linspace(5, 10, 10) + 5)),
)

# Save or pass win to the other scripts and use it to append to this window

# In other scripts:
win = 'window_371666b9beb910'
viz.line(
    X=np.column_stack((np.arange(20, 30), np.arange(20, 30))),
    Y=np.column_stack((np.linspace(5, 10, 10),
                       np.linspace(5, 10, 10) + 5)),
    win=win,
    update='append'
)
Ok , thanks for your answering
Hi,
I also tried to visualize different models on the same window. As you mentioned above, we should pass win parameter to the new scripts, but I can not pass win between two or more different scripts, I can only use win instantiated in front code.
How can I get win, or win_name like win = 'window_371666b9b910'?
In another way, we also can compare different model performance in one window using the environment selector in the main UI. But there is something insufficient if I compare model1.loss curve and model2.loss curve, the legend expected is
model1.loss
model2.loss
but what I get is
0.loss
1.loss
Is there any method to modify the compare_legend?
Thanks in advance.
In the first script you’ll get a window handle. Since it’s a string, the easiest way would be to save it to your disc and load it in another script.
I’m not sure about the compare_legend method. Could you explain this use case a bit more?
Hi,
I also think the first approach is convenient.
The second way I mean this, but I do not find any way to modify curve name in compare_legend.
Thanks for the information. Unfortunately, I haven’t used this compare method yet.
Did you figure it out somehow or did you get stuck somewhere?
The way I’m doing it is saving all the information I want to plot during training time. I’m saving it in a timestamped folder as a .csv file so I don’t run the risk of overwriting previous results. I’m then loading the data I want to plot in another script and put it into visdom. It requires some code to load the specific runs but should be able to produce a line curve with different curves & with a custom title.
Thanks for your reply.
According to the document,
individual plots are updated with legends corresponding to “x_name” where
xis a number corresponding with the compare legend pane andnameis the original name in the legend.
That is, if I want to compare two curves from different models, the curve will be named 1_curvename and 2_curvename, but what I want to display is model1_curvename and model2_curvename and I do not find a proper way to modify prefix in compare legend pane.
Of course, using windows name is a much more convenient and flexible way.
