How to write my custom activation function?

Hi all,

I need to write a custom activation function which should support backward derivative operation.

The behavior of the activation function should vary based on the recieved parameters a and b.

Below, I share my sample code using NumPy to explain my requirement better.

x = torch.linspace(-35,30,4000)
x_numpy=x.data.numpy()

def activation_function(inp,a,b):
  '''boundaries -31,28'''

  #finding the equation of two points (-31,0),(a,2)
  points = [(-31,0),(a,2)]
  x_coords, y_coords = zip(*points)
  A = vstack([x_coords,ones(len(x_coords))]).T
  m_1, c_1 = lstsq(A, y_coords)[0]

  #finding the equation of two points [(b,2),(28,0)]
  points = [(b,2),(28,0)]
  x_coords, y_coords = zip(*points)
  A = vstack([x_coords,ones(len(x_coords))]).T
  m_2, c_2 = lstsq(A, y_coords)[0]

  temp = np.array([])
  for i in inp:
    if i<-31:
      temp = np.concatenate( (temp, [0] ) )
    elif i>=-31 and i<a:
      #temp = np.concatenate( (temp, [i+31] ) ) #for a=-29
      temp = np.concatenate( (temp, [m_1*i+c_1] ) )
    elif i>=a and i<=b:
      temp = np.concatenate( (temp, [2] ) )
    elif i>b and i<28:
      #temp = np.concatenate( (temp, [-0.03571*i+1] ) ) #for b=-28
      temp = np.concatenate( (temp, [m_2*i+c_2] ) )
    else:
      temp = np.concatenate( (temp, [0] ) )
  return temp

x_numpy_new_1 = activation_function(x_numpy,-29,-28)

plt.figure(figsize=[24,4])
plt.plot(x_numpy,x_numpy_new_1,c='r',label="my_custom_activation_function")
plt.ylim([-0.5,2.5])
plt.xticks(np.arange(min(x_numpy), max(x_numpy)+1, 1.0))
plt.legend(loc='best')

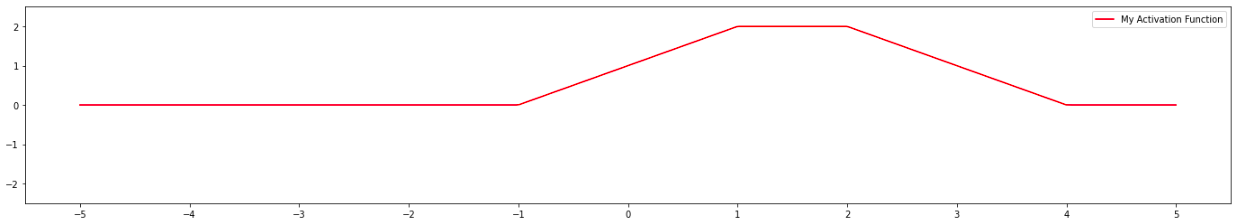
the result should look like this:

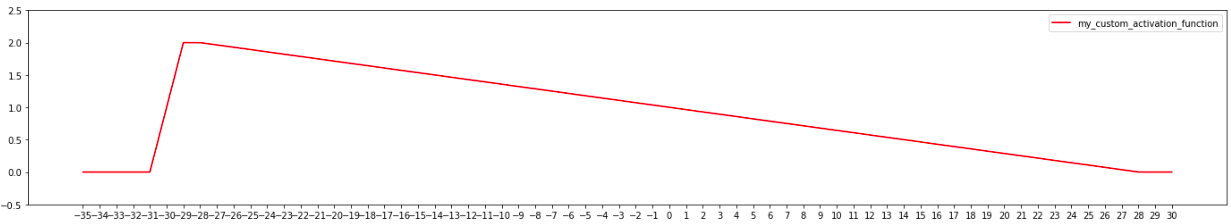
As you can see, the function takes a value of 0 below -31 and above 28. -31 and 28 are fixed numbers no matter what. In this example parameter ‘a’ was -29 and parameter ‘b’ was -28. And the function takes a value of 2 between ‘a’ and ‘b’. And between -31,‘a’ and ‘b’,28, I need to calculate the equations first to determine the output values.

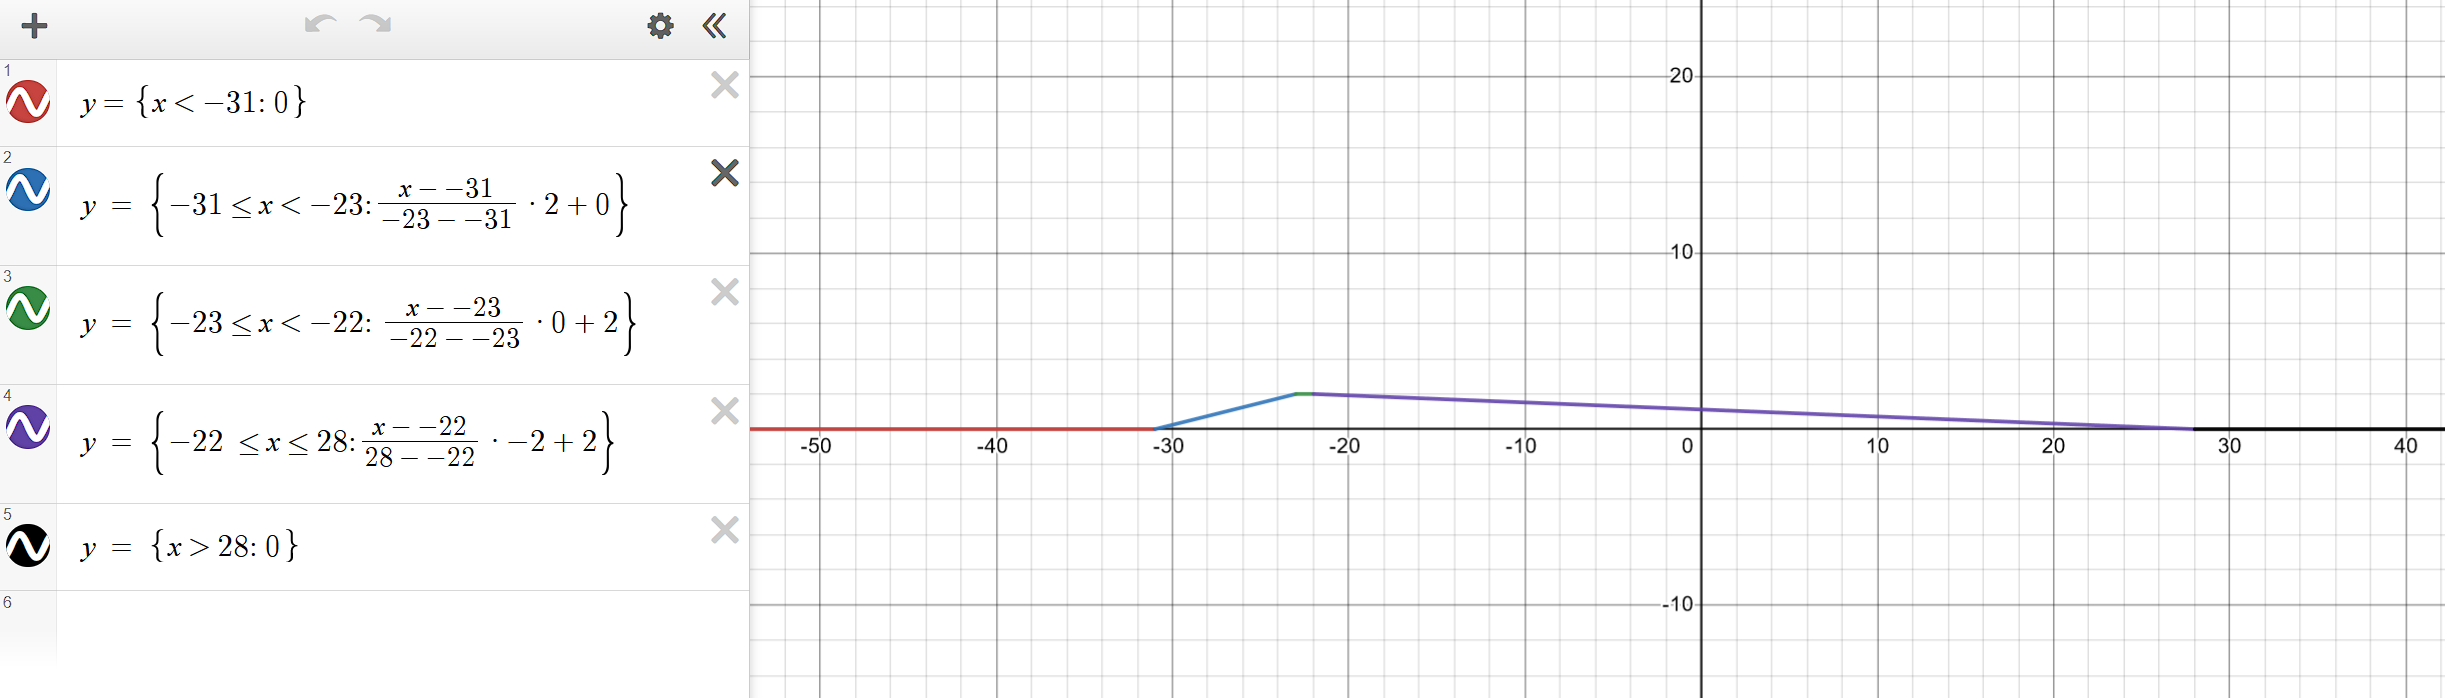
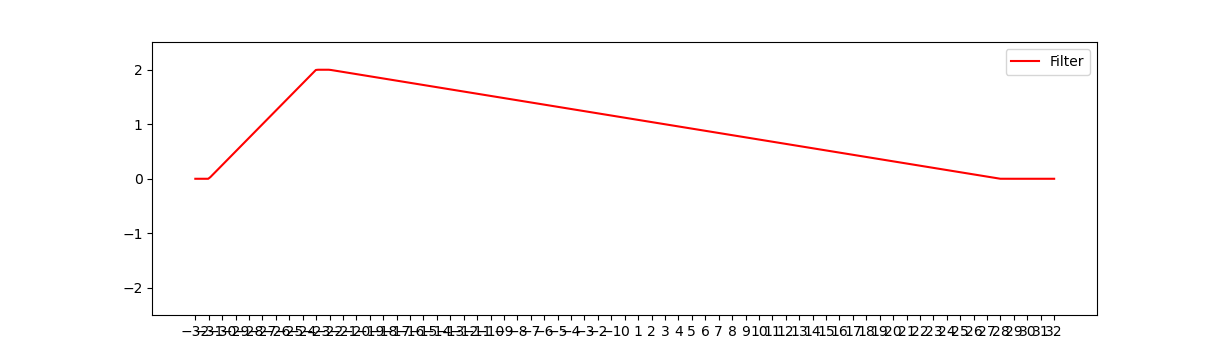
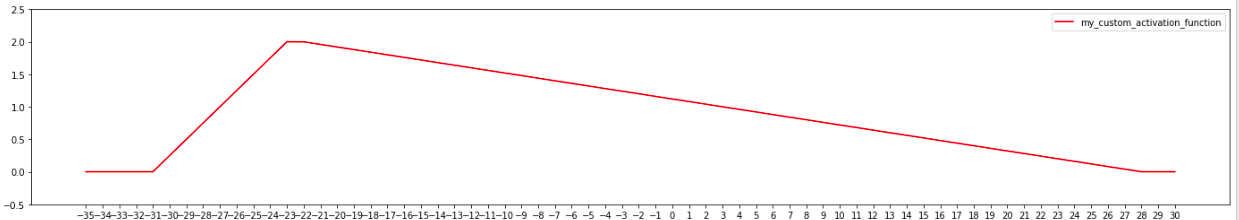
Here is the output for other iteration where the function outputs a value of 2 between parameters -23, -22

x_numpy_new_2 = activation_function(x_numpy,-23,-22)

plt.figure(figsize=[24,4])
plt.plot(x_numpy,x_numpy_new_2,c='r',label="my_custom_activation_function")
plt.ylim([-0.5,2.5])
plt.xticks(np.arange(min(x_numpy), max(x_numpy)+1, 1.0))
plt.legend(loc='best')

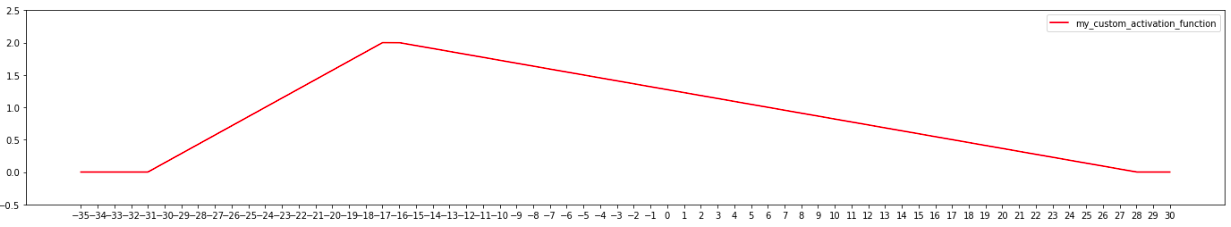
Final example where the function outputs 2 between parameters -17, -16

x_numpy_new_3 = activation_function(x_numpy,-17,-16)

plt.figure(figsize=[24,4])
plt.plot(x_numpy,x_numpy_new_3,c='r',label="my_custom_activation_function")
plt.ylim([-0.5,2.5])
plt.xticks(np.arange(min(x_numpy), max(x_numpy)+1, 1.0))
plt.legend(loc='best')

Any support will be highly appreciated.

Best wishes…

You will need to split the ranges. An example of Abs function is:

def abs(x): (x >= 0).float() * x - (x < 0).float() * x

Here is example:

x = torch.rand((10,)) * 2 - 1
print(x)
# tensor([ 0.8855, -0.6897,  0.6398, -0.4933,  0.0078,  0.2351, -0.1769,  0.9939, -0.7596, -0.3463])
y = abs(x)
print(y)
# tensor([0.8855, 0.6897, 0.6398, 0.4933, 0.0078, 0.2351, 0.1769, 0.9939, 0.7596, 0.3463])

This function by nature is differentiable. You can select different ranges using conditions and multiply it with the function you want it to be in that range and then sum all ranges. e.g for linear function in different ranges range is:
((x >= a1) & (x < a2)).float() * (m1*x + b1) + ((x >= a2) & (x < a3)).float() * (m2*x+b2) + ...
This is not an optimal way to write a piecewise function. Also if you forget to include a range the slope there will be zero and model may not converge. Also the more pieces you added the more computationally expensive it becomes. An alternative solution is to write different forward and backward passes. In forward pass you only compute the function as it is. In backward pass you return the slope of function at those points which should be constant for linear pieces. (It should become as fact as relu)

Thanks for your comment. I am having difficulties to understand your approach.

I actually need a working code example of the implementation of my question:(

For example, using below code I can implement an activation function like a filter. But,it actually doesn’t solve my question.

ht = nn.Hardtanh()

class MYFUNC7(nn.Module):

    def __init__(self):

        super().__init__() 

    def forward(self, input):

        return my_act_func_filter(input) 

def my_act_func_filter(input):

    return (ht(input) + ht(-input+3))

y = torch.linspace(-5,5,400)
func7 = MYFUNC7()
output = func7(y).data.numpy()

plt.figure(figsize=[24,4])
plt.plot(y,output,c='r',label="Filter")
plt.ylim([-2.5,2.5])
plt.xticks(np.arange(min(y), max(y)+1, 1.0))
plt.legend(loc='best')

But, I need a shape like below as I shared in my previous post:

And it will be configurable by the two parameters ‘a’ and ‘b’.

You first need to design function in something like graphing calculator and solve y = f(x) for individual piece of the function and convert it to code.

Here is sample code (ignore where function is zero):

import torch
import numpy as np
import matplotlib.pyplot as plt

def actfn(x):
    return ((x >= -31) & (x < -23)).float() * (x + 31) / 4 + \
           ((x >= -23) & (x < -22)).float() * 2  + \
           ((x >= -22) & (x <= 28)).float() * ((-x - 22) / 25 + 2)


y = torch.linspace(-32, 32, 400)
output = actfn(y)
plt.plot(y,output,c='r',label="Filter")
plt.ylim([-2.5,2.5])
plt.xticks(np.arange(min(y), max(y)+1, 1.0))
plt.legend(loc='best')
plt.show()

1 Like