Hello everyone,
I am facing some memory issues running my model on multiple GPUs with DDP. I want to report to you the experiments I made to understand the memory utilization of the combination of workers + DDP. In all the experiments I will report in this post I will use always the same model, so the size of the model is always the same.
I have 4 GPUs with 16GB each. First of all, I used only one to understand the highest batch that fits on it. The maximum batch size is 64 (I started to have CUDA OOM with 128). Then, in order to increase the batch size, I started to use DDP with batches of 64 for each process (1 process per GPU). Using 2 GPUs with a total batch of 128 caused CUDA OOM. I have read online that the DDP uses part of the GPU memory to store the communication bucket. So I assume that this communication bucket does not fit into memory. I started to decrease the per-GPU batch size to 60, then 55, and finally to 50 (resulting in a total batch size of 100 on 2 GPUs). Unfortunately, none of these batch sizes worked, For curiosity, I started to analyze the memory usage of 1 single GPUs with a batch of 1. The total memory usage is 3.4G. I then tried to use DDP with a batch of 2 (1 per-GPU) resulting in 3.9G. This experiment demonstrates the overhead made by DDP. Finally, I tried to increase the number of workers and I have found that the final memory usage on GPU increases. This last founding shocked me because I thought that the workers simply increase the RAM usage, not GPU.
More specifically, whenever I use DDP I have several processes per GPU. The first process I see is the one performing the training (3.9G), then there are N_GPUS-1 processes that I suppose are in charge of keeping the communication with the other processes opened (0G each), and finally, the other ones should be the workers (0.6G each). Thus the memory usage on each process is 3.9G + num_workers*0.6G.
It’s not clear to me why the workers have a memory footprint on the GPU. Can someone help me to understand?
This shouldn’t be the case. Could you share an executable code snippet, which shows an increase in GPU memory using CPUTensors in the Dataset after increasing the workers in the DataLoader?
Hi @ptrblck , the code I am using is spread among different files so as soon as I can I will create a code snippet and try to reproduce this issue.
In the meantime I want to share with you the findings:
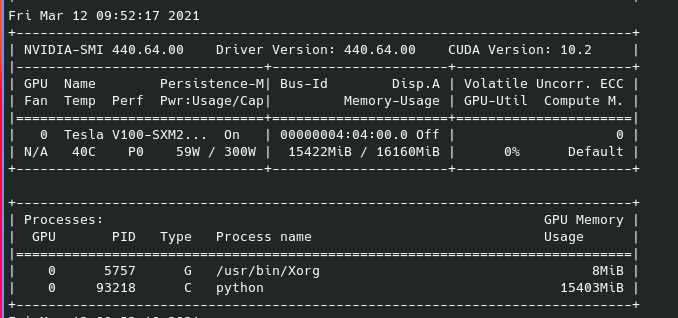
1 GPU, batch=64, 0 workers:
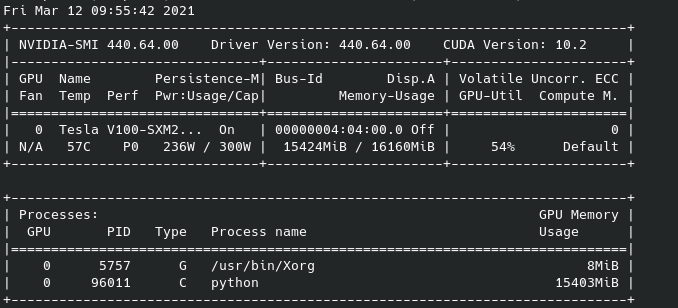
1 GPU, batch=64, 7 workers:
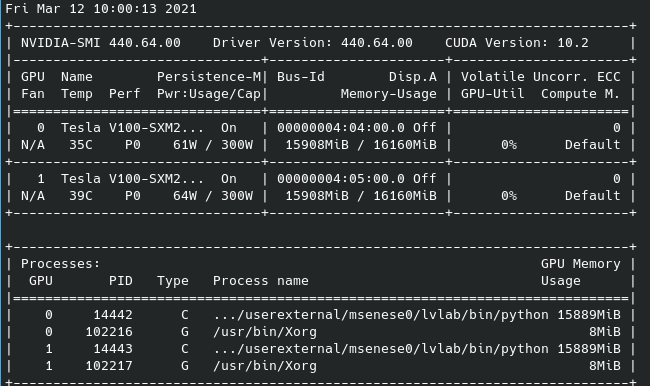
2 GPUs, batch=128, 0 workers:
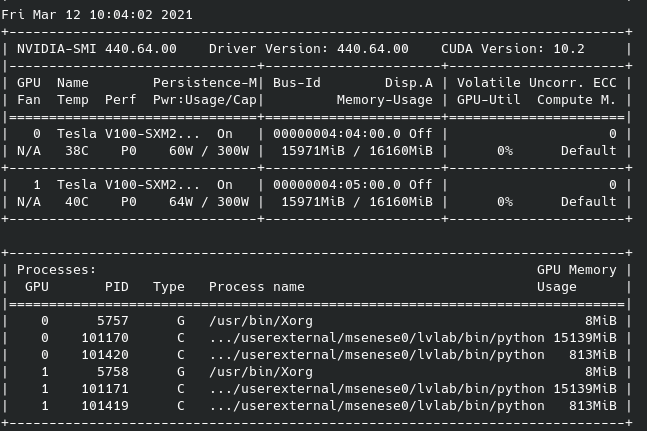
2GPUs, batch=128, 1 worker:
As you can see the last one has different processes spawned per GPU and is the only one causing OOM (batch=128 with 0 workers instead is fine). The screenshot was taken just before the OOM.
My DataLoader uses pin_memory=True, so I exclude to have CUDATensor inside the __getitem__, otherwise an exception occurs. I also used .to(device, non_blocking=True).
I created a simpler version of my code. If you run this code you will find the unusual worker processes to be spawned on GPUs. I have found out that these processes are spawned only if I set a custom collate_fn into my DataLoader. If you use the default collate_fn the strange processes do not seem to spawn. It is not yet clear to me the why.
@ptrblck I tried again to debug the code. The problem is there every time I use a collate_fn that is a method of a class that contains the model as one of its attributes (self.model). Each time this happens, there is a new cuda context created. I don’t know if this can be considered a bug or it is a normal behavior known by the developers
Another thing that I have noticed: even if I use the default collate_fn (without specifying a custom one), additional processes are created on GPUs with 0MiB each (even with 0 workers). The number of these processes are equal to N_GPUS-1, so I suppose they are in charge of keeping the connection opened with the other GPUs. Am I right?
Using the model or any CUDA operations in the collate_fn is uncommon, I think (at least I haven’t seen a use case so far) and I guess not well tested.
The additional CUDA context creation might come from the usage of multiprocessing.
I also don’t know what kind of 0MB process is created as I haven’t seen it before.
In your code snippet you are also using multiprocessing with DDP. What’s the reason for not using DDP directly?